6. Sea ice#
Note
This is a cool interactive webiste to illustrate sea-ice conditions: Charctic Interactive Sea Ice Graph. Please around with it!!!
Note
NSIDC All About Sea Ice offers daily updates on sea ice conditions in the Arctic and Antarctic
Note
What is sea ice?#
Sea ice is formed in the salty ocean water (-1.8°C)
Sea ice appears in Arctic and Antarctica. Sea ice can form in Bohai Bay.
Sea ice covers about 25 million square km of the Earth’s surface (about 2.5 times the area of Canada, or 15% of world’s ocean).
Classification of sea ice#
By age: first-year v.s. multi-year
New ice: < 10 cm thick
Young ice: 10-30 cm
grey ice: 10-15 cm
grey-white ice: 15-30 cm
First-year ice: > 30 cm, but melt out in melting season (summer)
Multi-year ice: 2-4 m, survived melting season
Sea ice formation#
Phase diagram of salt water
Ice growth process
Rough ocean: pancake ice -> rafting or ridging -> cementing or consolidation -> sheet ice
Calm ocean: grease ice -> nilas -> rafting -> congelation ice -> sheet ice
Salinity and brine
The role of waves
Multi-year sea ice#
Freshwater supplies for polar expeditions.
Multi-year ice has different electromagnetic properties from first-year ice, so that satellite sensors can distinguish them.
More multi-year ice in Arctic than in Antarctica.
Sea ice features#
Sea ice and melting ponds
Pancake ice
Ridged sea ice
Leads
Polynyas
Sea ice and oceanic mesoscale eddies
Lake ice
Sea ice thermodynamics#
Freezing degree days (FDD in deg C).
Thickness (cm) = 1.33xFDD\(^0.58\) (Lebedev 1938).
Snow cover slows the growth of ice.
Albedo effect (melting pond -> 0.4-0.5 and surface 0.75).
Thermodynamic equilibrium thickness (no heat transfer): 3 meters in Arctic; 1-2 meters in Antarctica.
Sea ice dynamics#
Dynamics does not direct contribute to sea ice formation or reduction.
Winds
generally sea ice that drifts freely moves at 2 percent of the wind speed
sea ice surface roughness (angle).
20-40 degrees to the right in Northern Hemisphere.
Ocean currents
Coriolis force
Internal ice stress
Sea surface tilt
Sea-ice impacts on Earth system#
Albedo feedback
Atmospheric heat transport
Thermohaline circulation
Greenland melting
sea ice (brine effect)
Rivers (10% of world’s river discharge)
Sea-ice movements
Heat exchange
Sea ice gridded data#
Sea-ice concentration (SIC):
the amount of area covered by sea ice within one grid relative to some reference area
0-1 to 0-100%, unitless
Sea-ice area (SIA):
total area covered by sea ice -> area size times sea-ice concentration
unit in km\(^2\) or mile\(^2\)
Sea-ice extent (SIE):
having sea ice or no sea ice in one grid -> 0 or 1
threshold: sea-ice concentration 15%
always larger than sea-ice area
unitless or unit in km\(^2\) or mile\(^2\)
Sea-ice thickness (SIT):
freeboard
draft
unit in meter
Arctic field study#
Not much reliable sea ice records before 1979.
Russian has the most sea-ice records, but when Soviet Union collapsed there’s no funding to sustain.
Beginning in September 2019, the Multidisciplinary drifting Observatory for the Study of Arctic Climate (MOSAiC) expedition sent the German research icebreaker Polarstern to the Arctic to spend a year trapped in sea ice.
Remote sensing measurements#
Visible
Infrared
Passive microwave
Active microwave
Sea-ice modelling#
Sea-ice prediction#
Methods:
heuristic model
statistical framework
dynamical framework
deep learning framework
Source of predictability:
sea-ice reemergence
atmospheric precursor
oceanic precursor
sea ice itself (?)
Changing sea ice in Arctic and Antarctica#
September Arctic sea ice
Arctic sea ice melt and freeze day
Riverine impact on Arctic sea ice
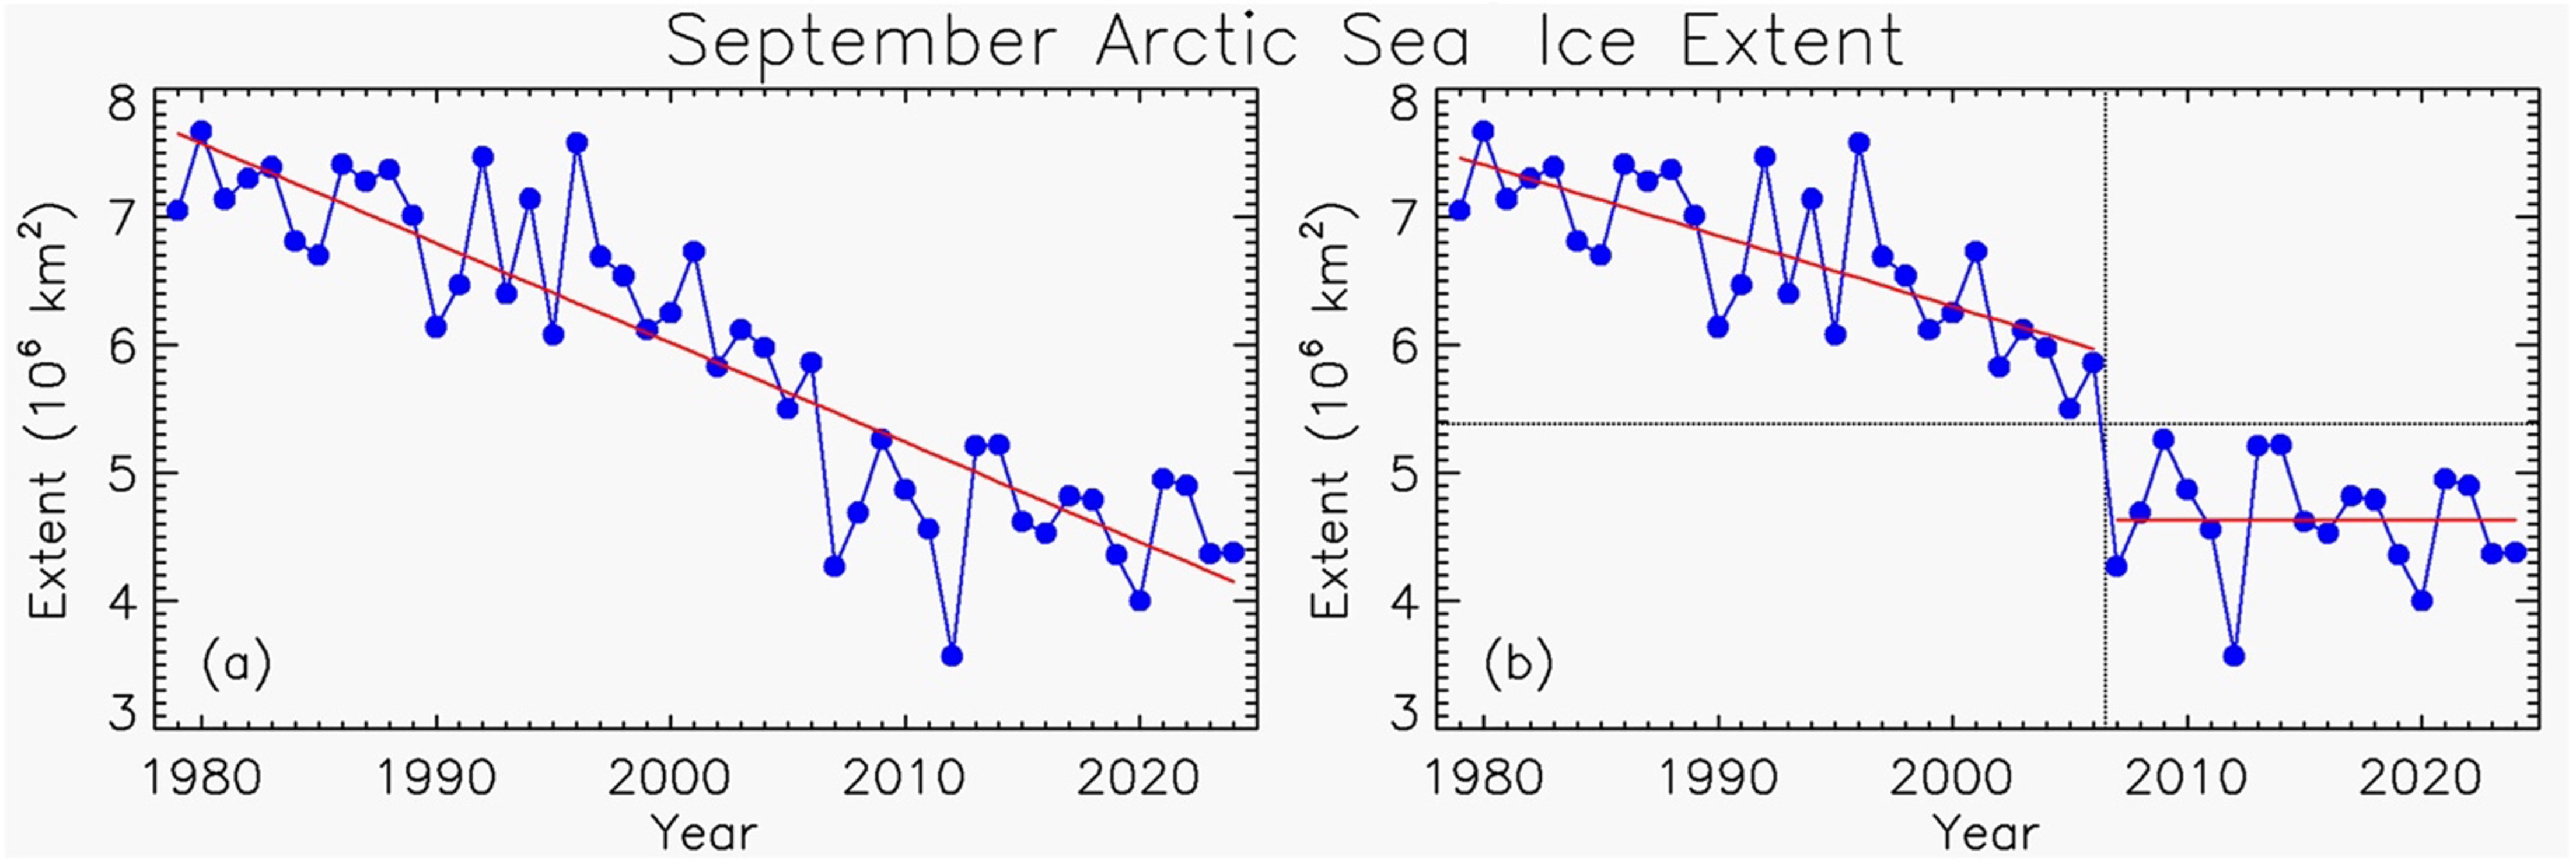
Fig. 21 These two graphs show September monthly average sea ice extent. The left graphs shows the overall trend of sea ice loss, while the right graph shows the trend derived from statical analysis, adapted from Stern, 2025. For the entire 1978 to 2024 record, the trend shown is −0.78 × 10⁶ km2 per decade. The right graphs shows the linear fit for 1979 to 2006 as −0.55 × 10⁶ km2 per decade, followed by a flat trend for 2007 to 2024 with an value 4.63 × 10⁶ km2. — Credit: Stern, H. L. et al., 2025#
February Antarctica Sea Ice
Increase rather than decrease under global warming before around 2016
abrupt decrease after 2016
Sea Ice in the future
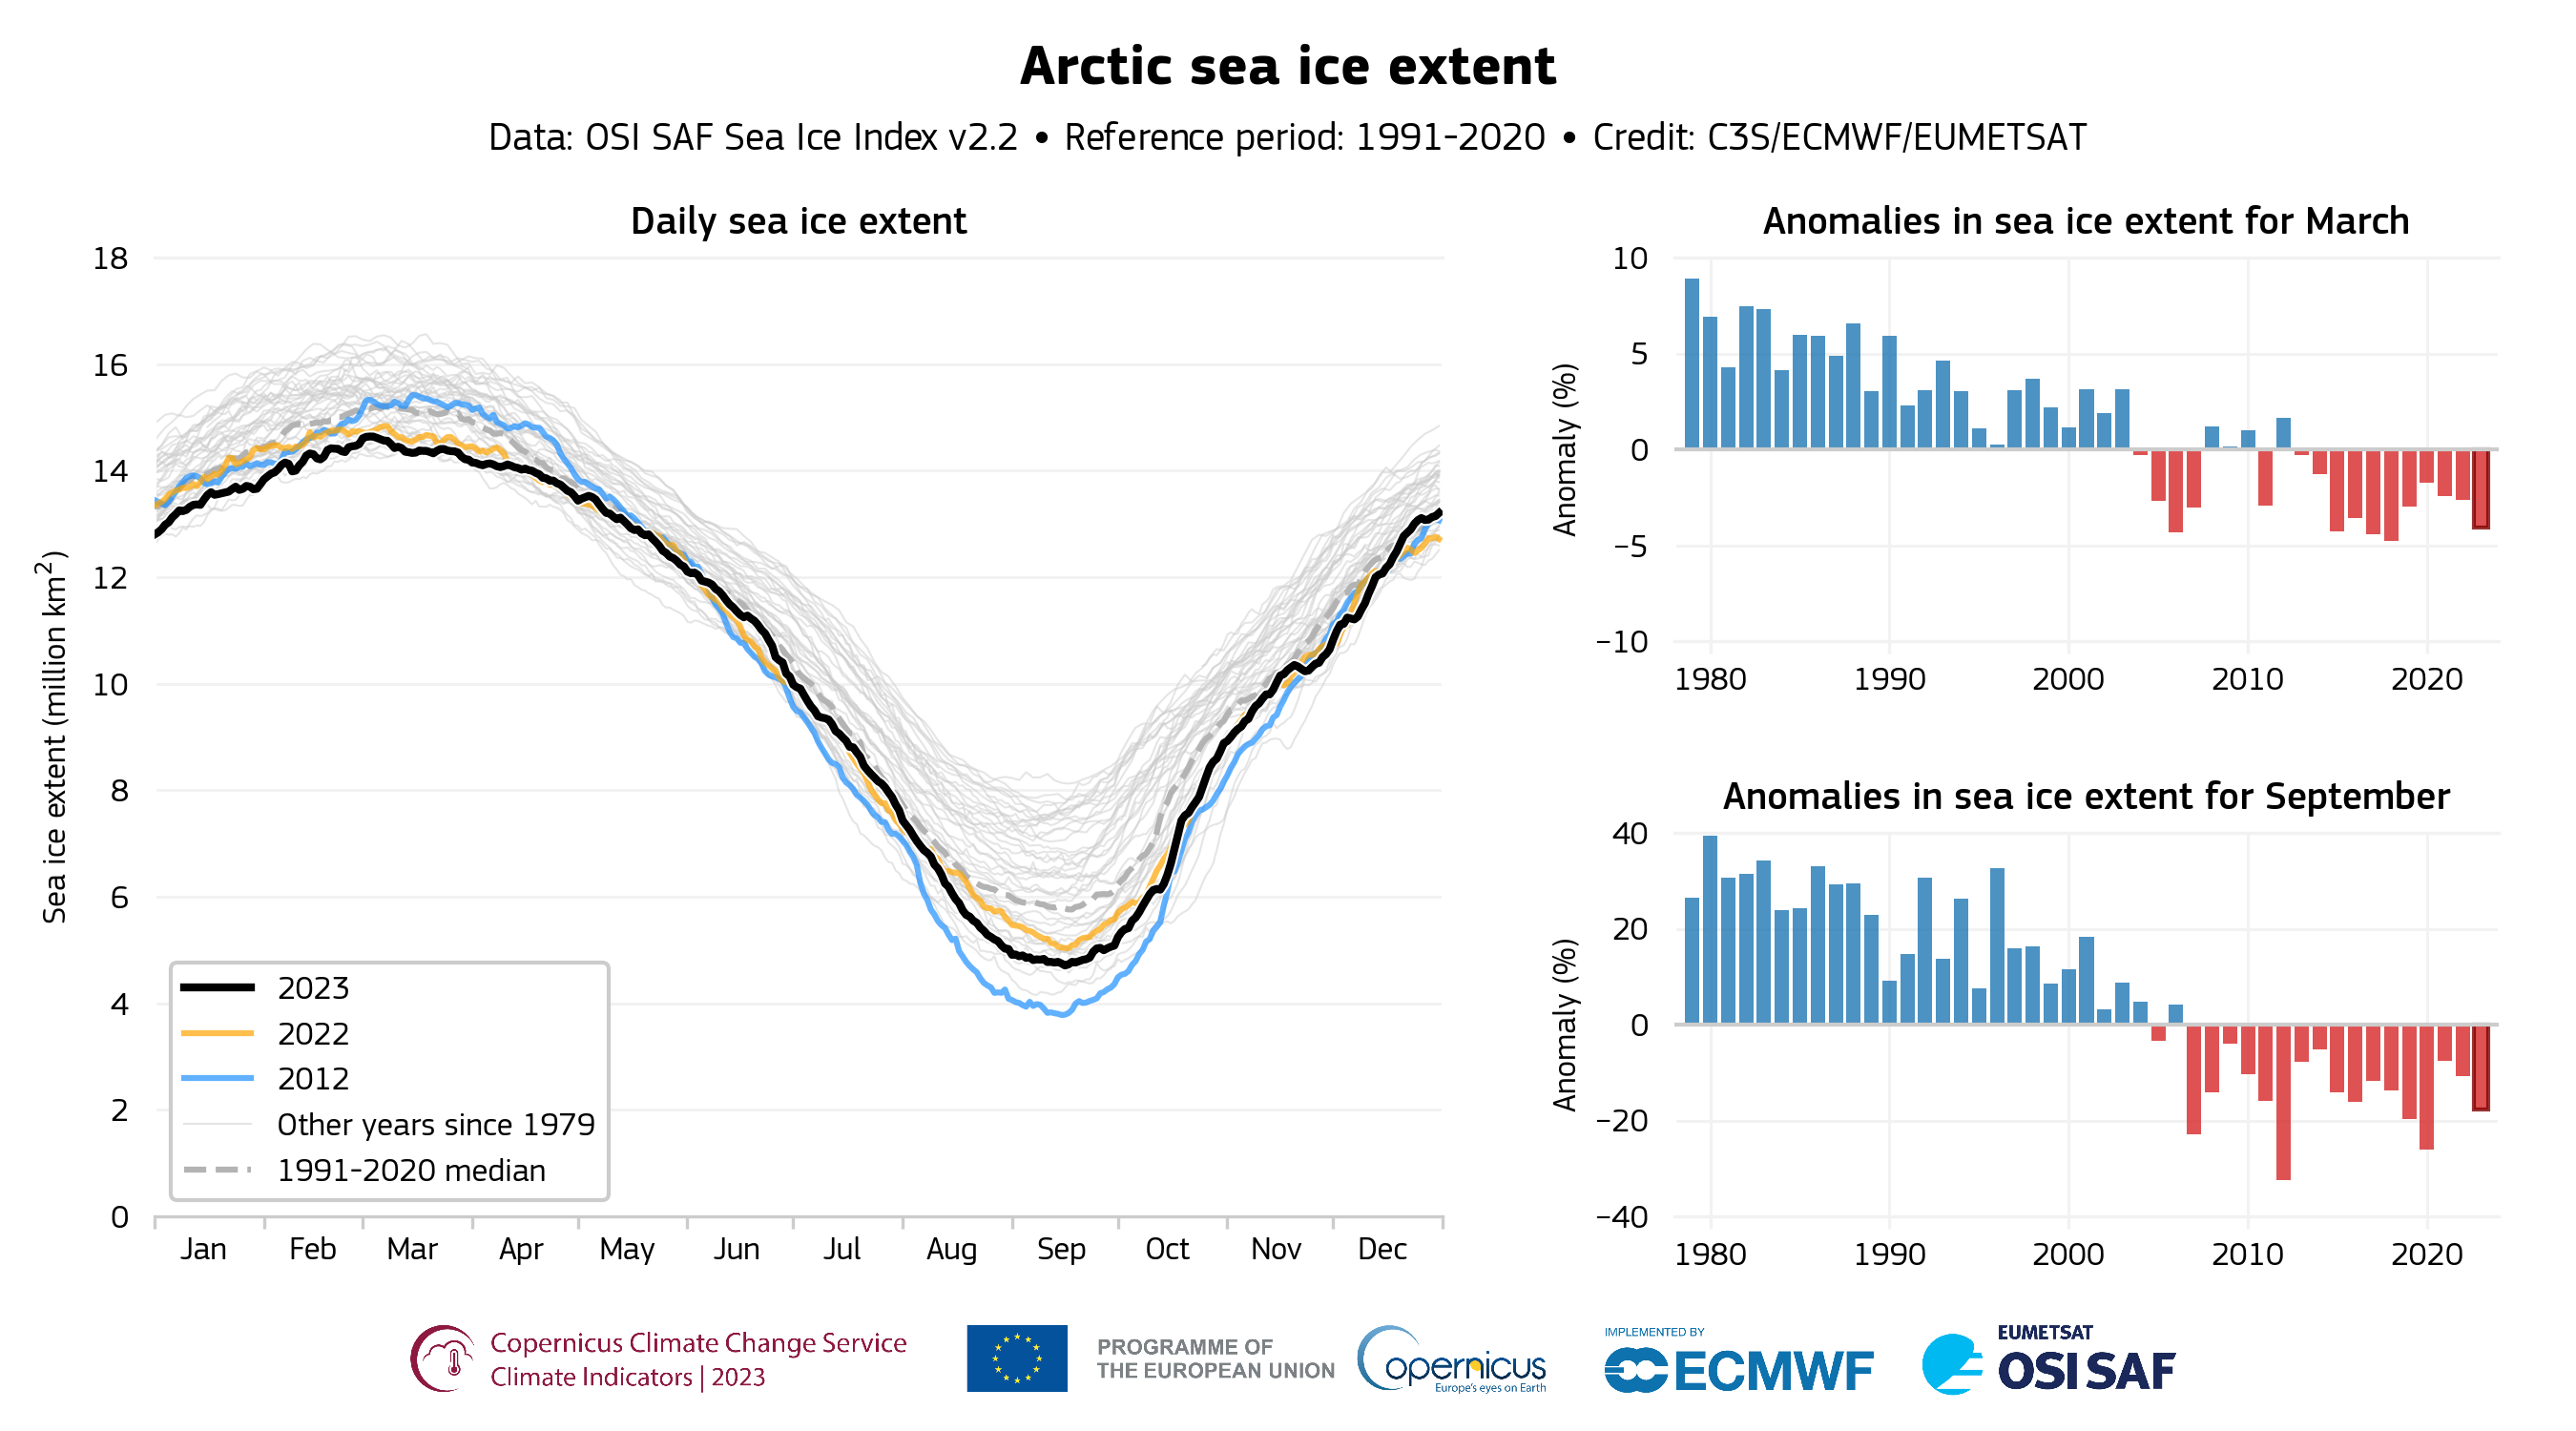
Fig. 22 (Left) Daily Arctic sea ice extent (million km2) from 1979 to 2023, showing 2012 (blue line), 2022 (orange line), 2023 (black line), all other years since 1979 (thin grey lines), and the median for the 1991–2020 reference period (dashed grey line). (Right) Monthly anomalies (%) in Arctic sea ice extent for March (Top) and September (Bottom) from 1979 to 2023. The anomalies are relative to the respective monthly averages for the 1991–2020 reference period and expressed as a percentage of these averages. Note the different ranges of the vertical axes. Data source: OSI SAF Sea Ice Index v2.2. Credit: C3S/ECMWF/EUMETSAT and ECMWF.#
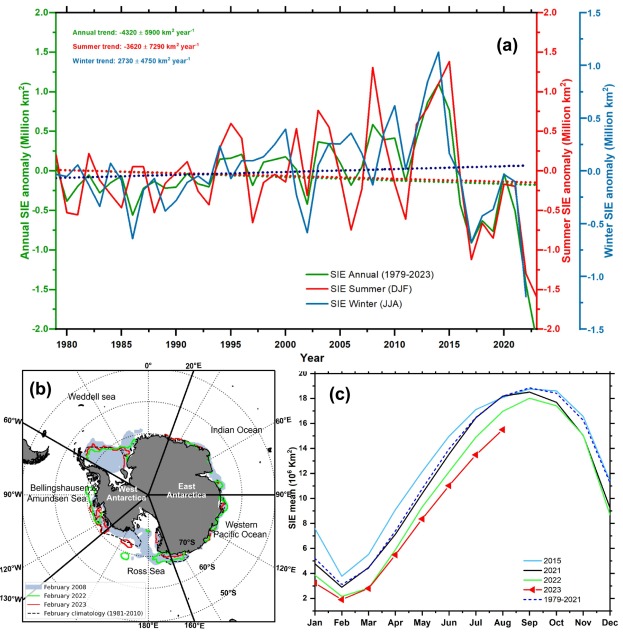
Fig. 23 The annual, summer, and winter SIE anomalies from 1979 to 2023 are shown in (a) using green, red, and blue, respectively. Corresponding trend lines are indicated as dotted lines. The maximum February SIE is represented as a shaded blue area in (b), while the lowest SIE is shown in red, the second lowest in green, and the median extent as a dotted black line. Monthly mean variations in maximum SIE and SIE after 2020 with a climatological period of 1979–2021 are displayed in (c). (For interpretation of the references to colour in this figure legend, the reader is referred to the web version of this article.) Source: Swathi et al. (2025)#
Sea ice geoengineering and management#
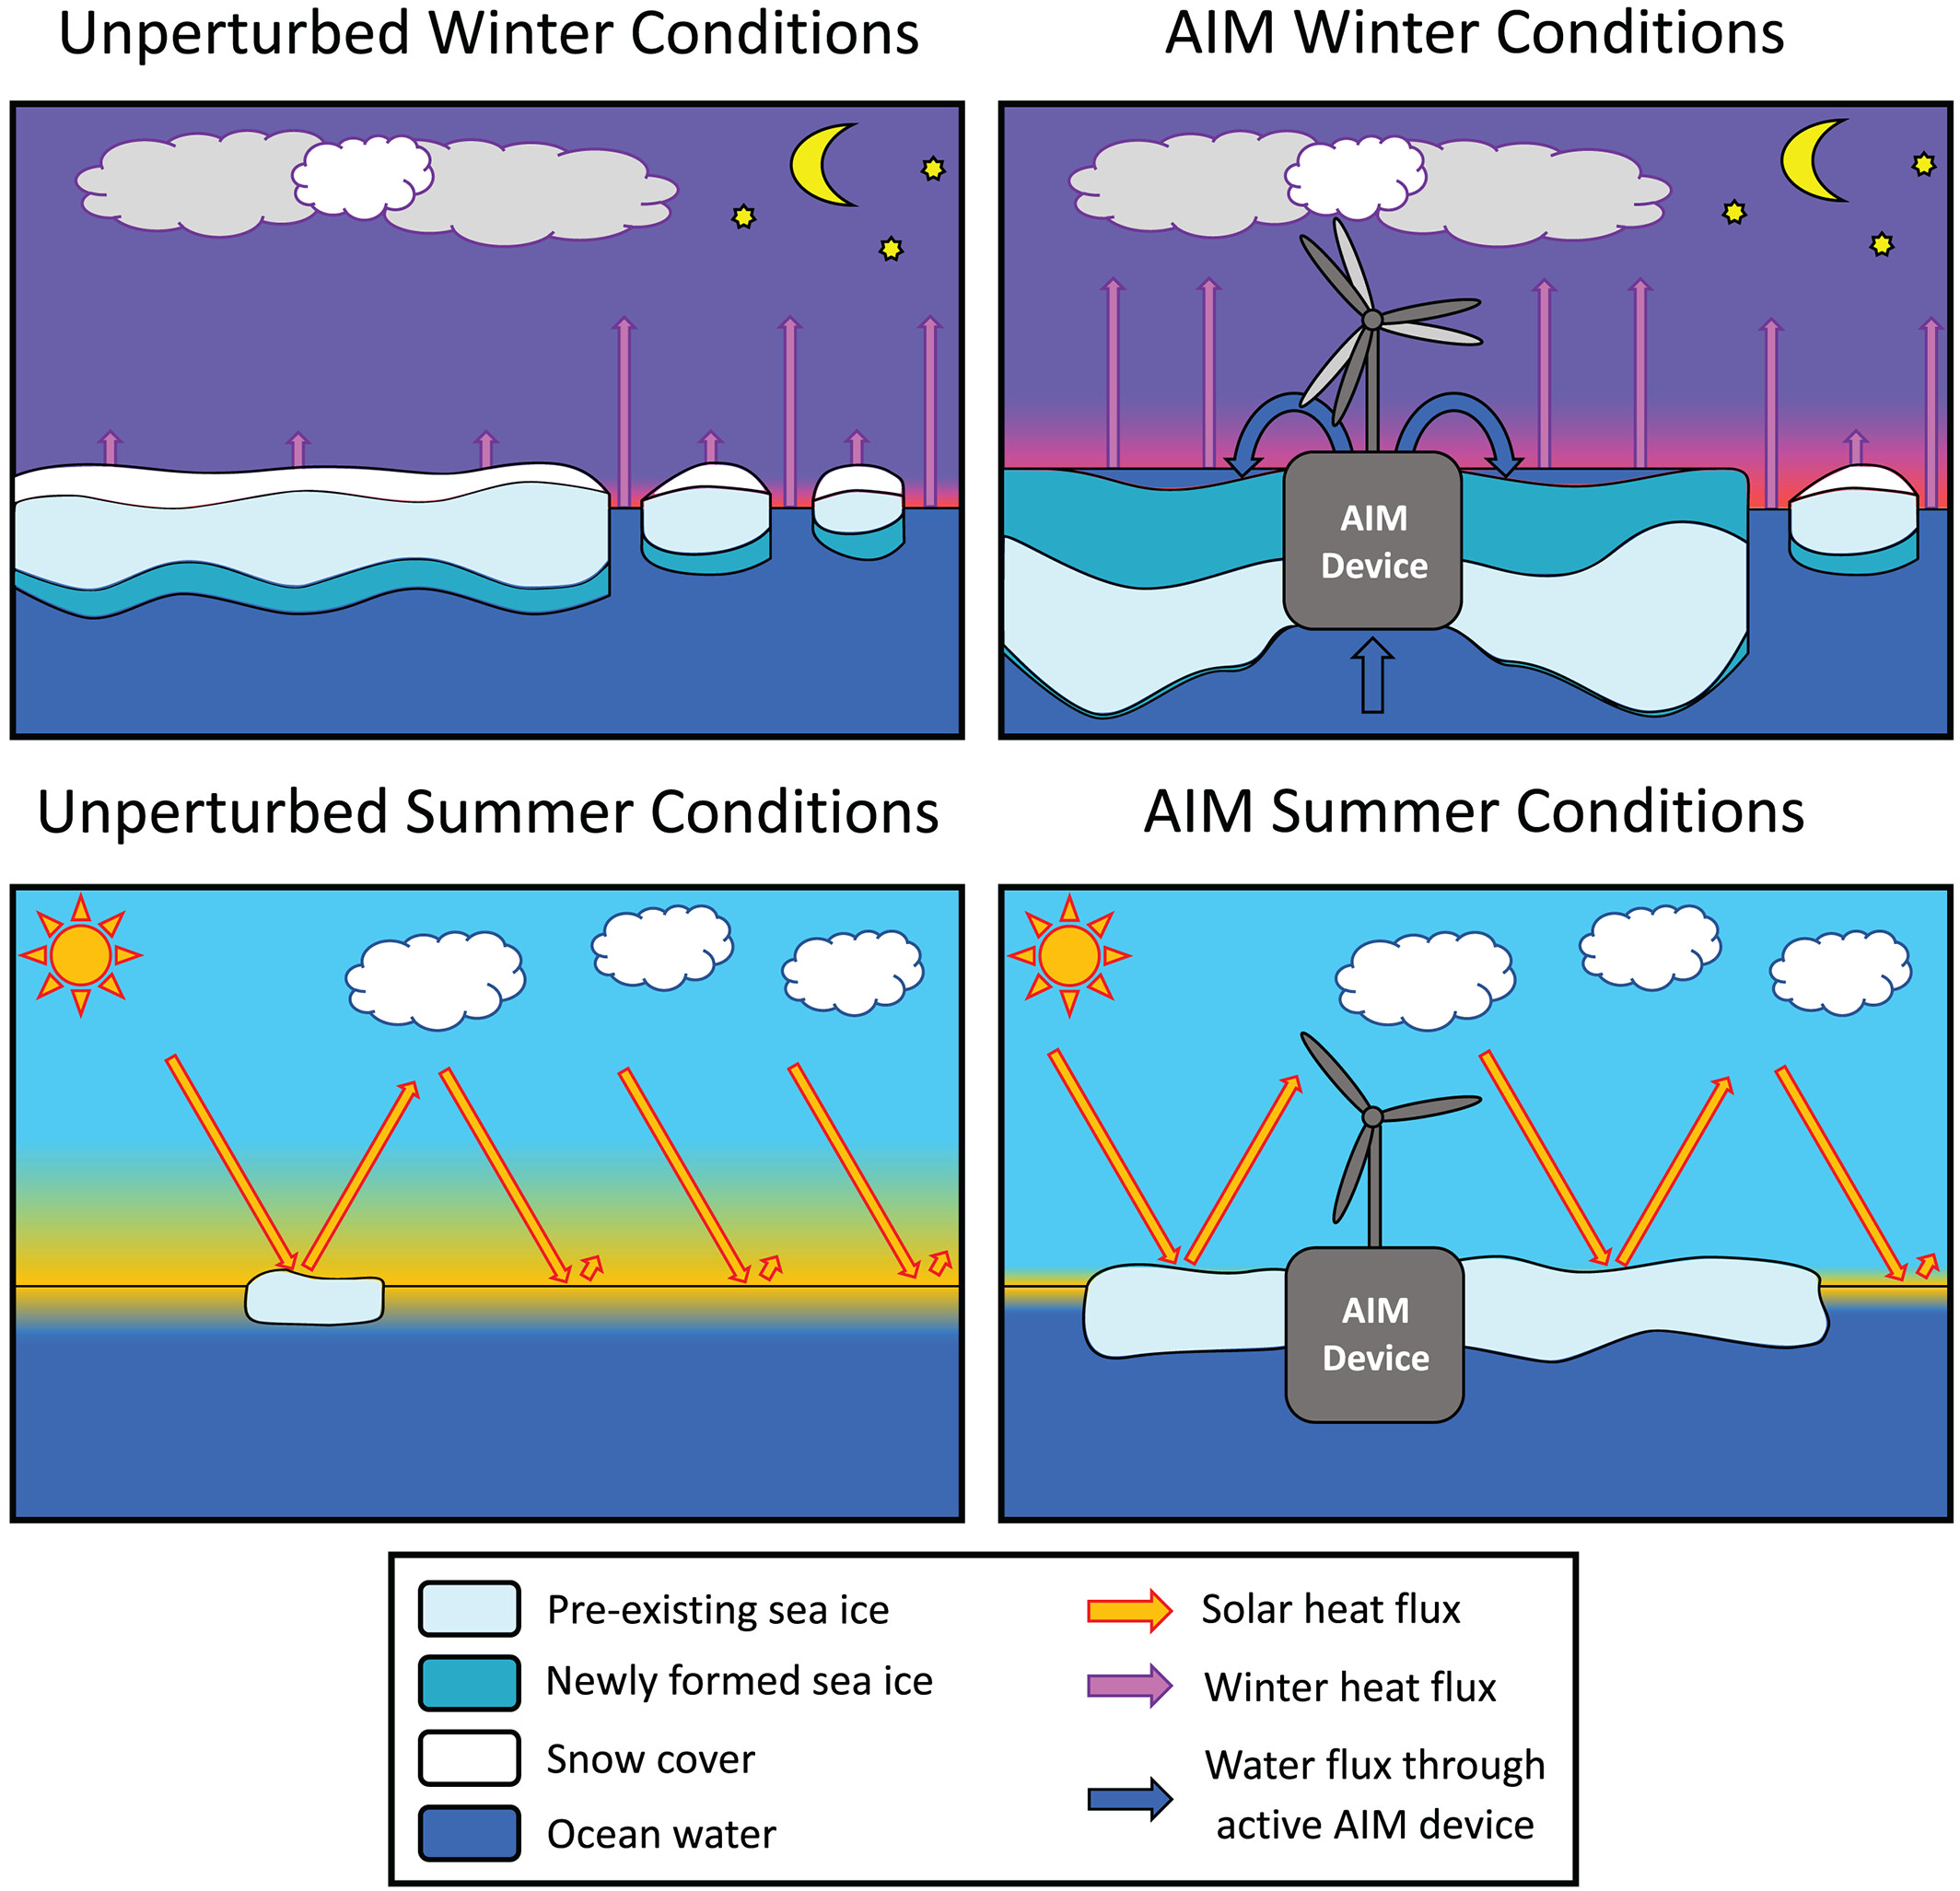
Fig. 24 Idealized representation of the 21st century sea ice system with and without Arctic Ice Management (AIM). In unperturbed winter conditions (top left) the sea ice and snow act as insulator reducing the heat flux from the warmer ocean to the much colder atmosphere. The sea ice growth takes place mostly at the ice-ocean interface and is relatively slow (dark blue fraction of the ice floes). By summer (bottom left) most of the ice has melted, leading to an ice-free Arctic Ocean in the second half of the century and amplifying the warming through the ice-albedo feedback (yellow fraction of ocean). In AIM conditions (top right) ocean water is pumped onto the ice, leading to larger heat flux and rapid ice growth at the surface. More ice withstands the summer melt (bottom right) and increases the surface albedo. Source: Zampieri and Goessling (2019).#