5. Glaciers#
Note
The Randolph Glacier Inventory is a global inventaroy of glacier outlines. This is cool!!! You could play around it.
Glacier types#
Alpine glaciers
Continental ice sheets
Climate conditions for glaciers#
High snowfall in winter + cool temperature in summer
Accumulated snow transforms into firn and then ice
In polar and alpine regions
Sources and losses
Locations of glaciers#
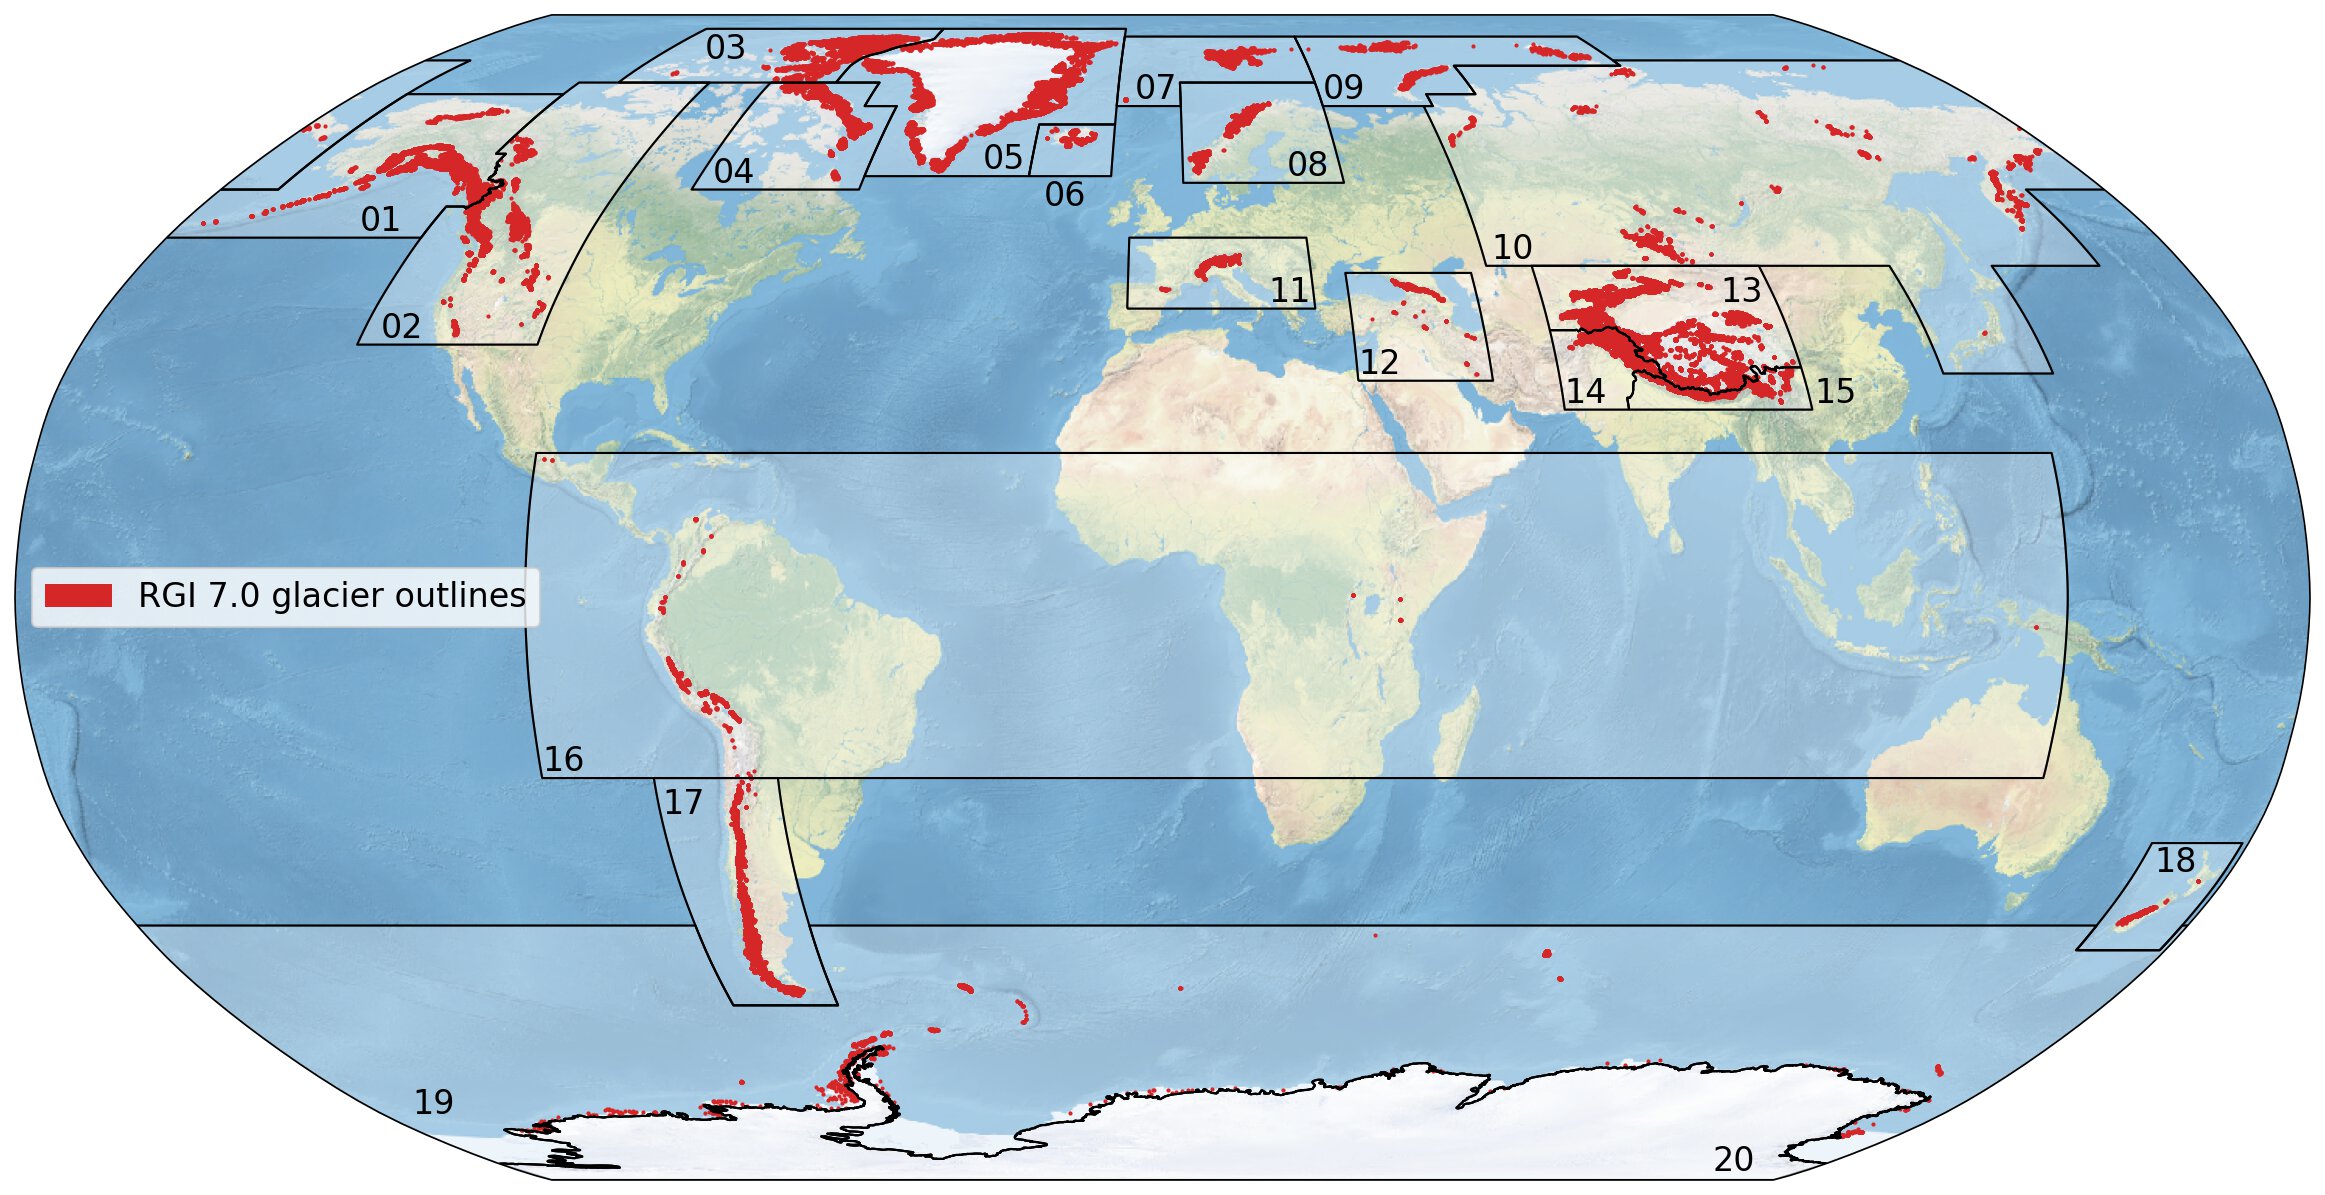
Fig. 9 First-order regions of the RGI version 7.0 and glacier locations in red. Soirce: RGI#
The life cycle of a glacier#
Snow -> granular ice -> firn -> glacial ice
Zones of accumulation and ablation
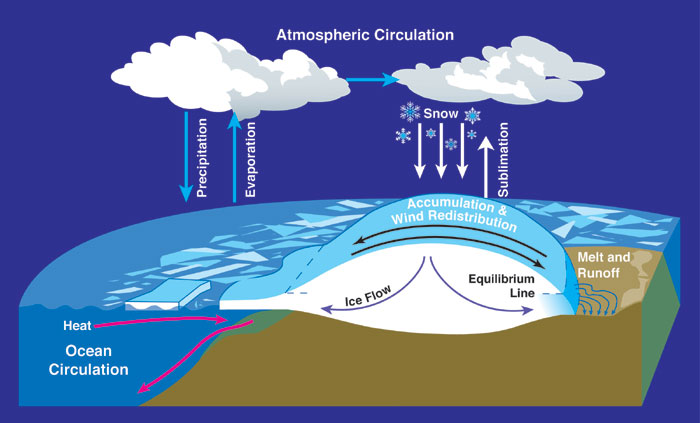
Fig. 11 Glacier mass balance and atmospheric circulation. By NASA. From Wikimedia Commons.#
Moraines#
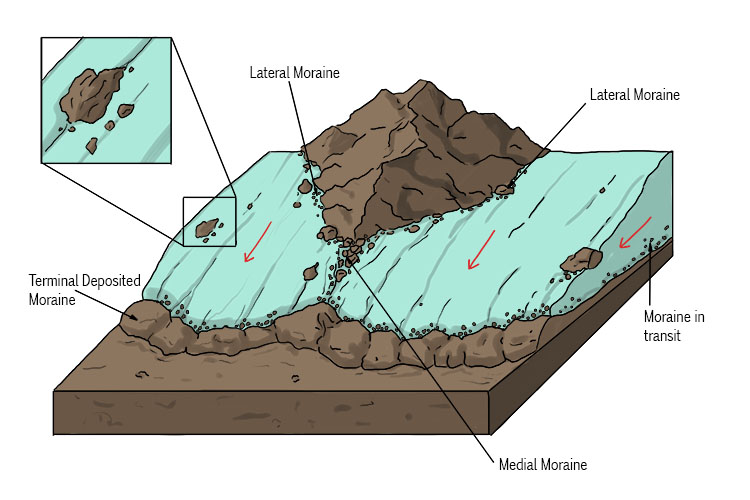
Fig. 12 A moraine is an accumulation of loose (unconsolidated) debris – dirt and pieces of rock – that is carried along by a glacier and deposited at some point during the glacier’s journey. Source: here#
Glacier observations and modelling#
In situ and airborne survey
Satellite observations (e.g., GRACE)
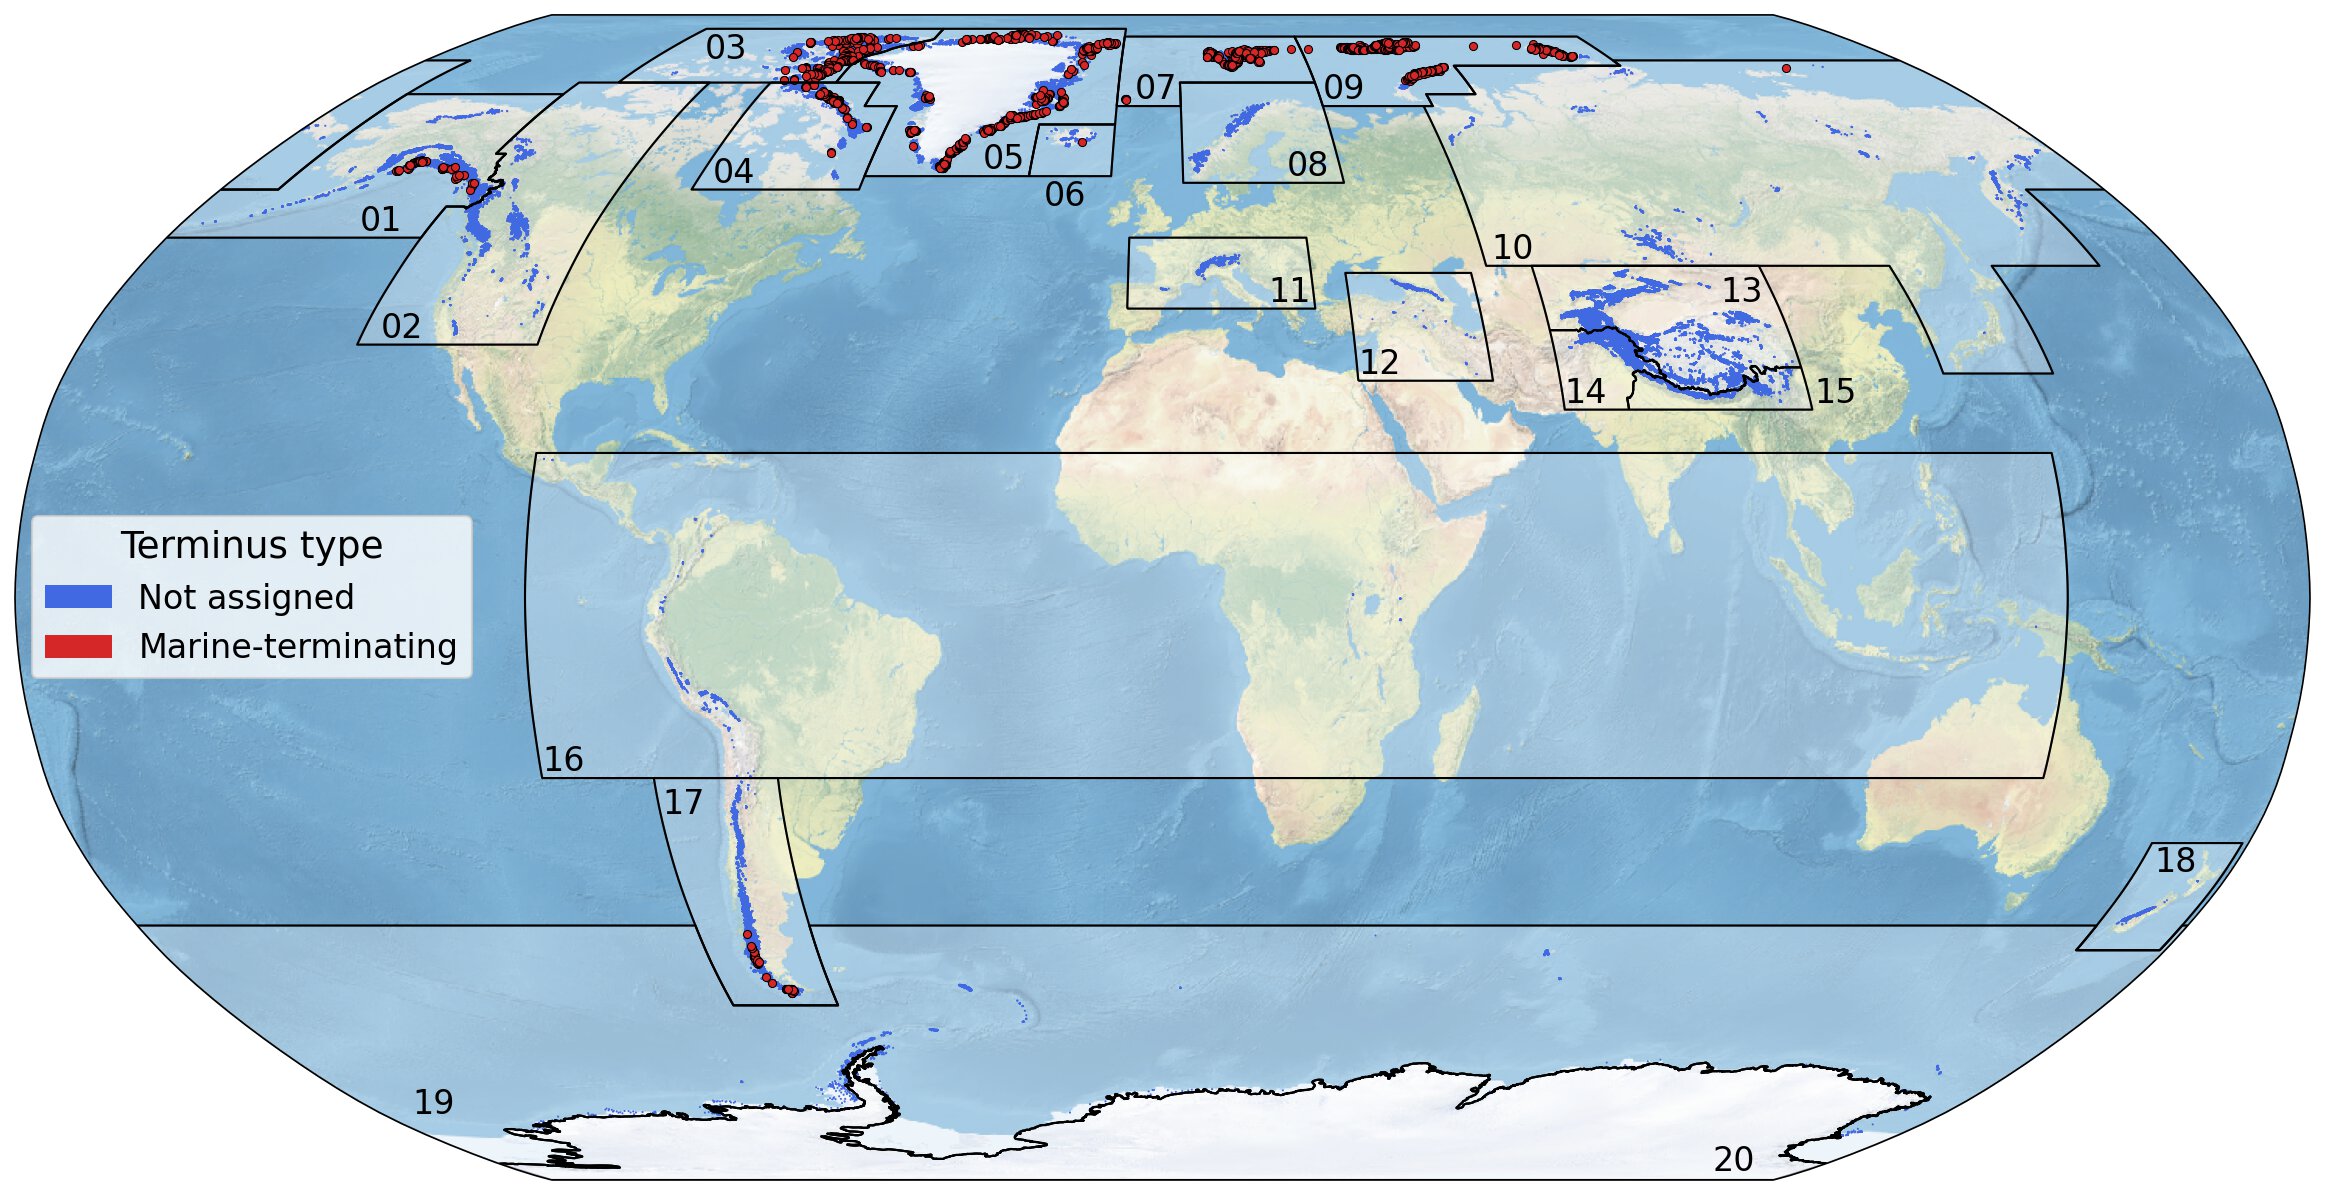
Ice shelves and ice bergs#
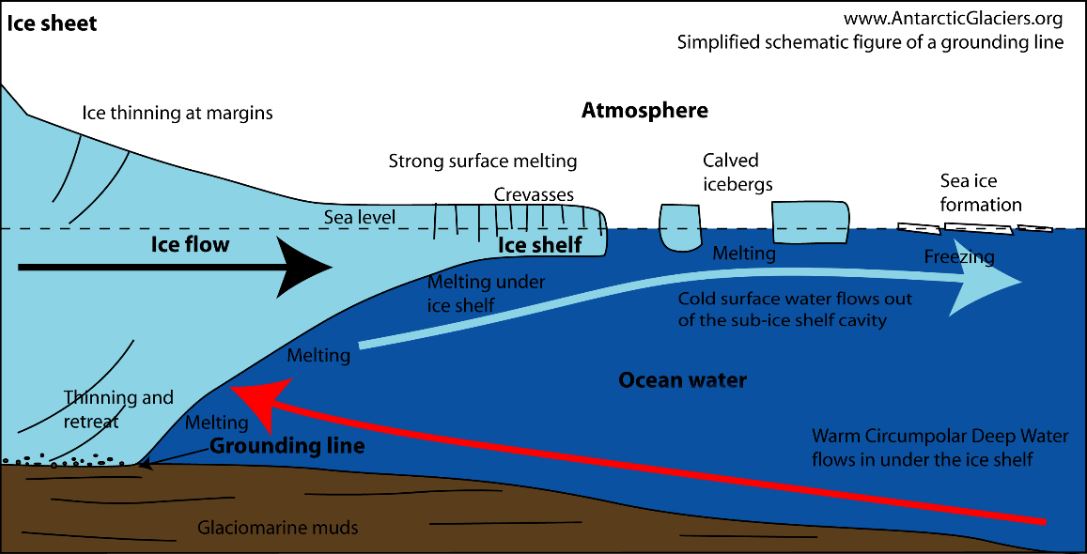
Fig. 13 Source: Arctic Kingdom#
Glacier retreat and sea level rise#
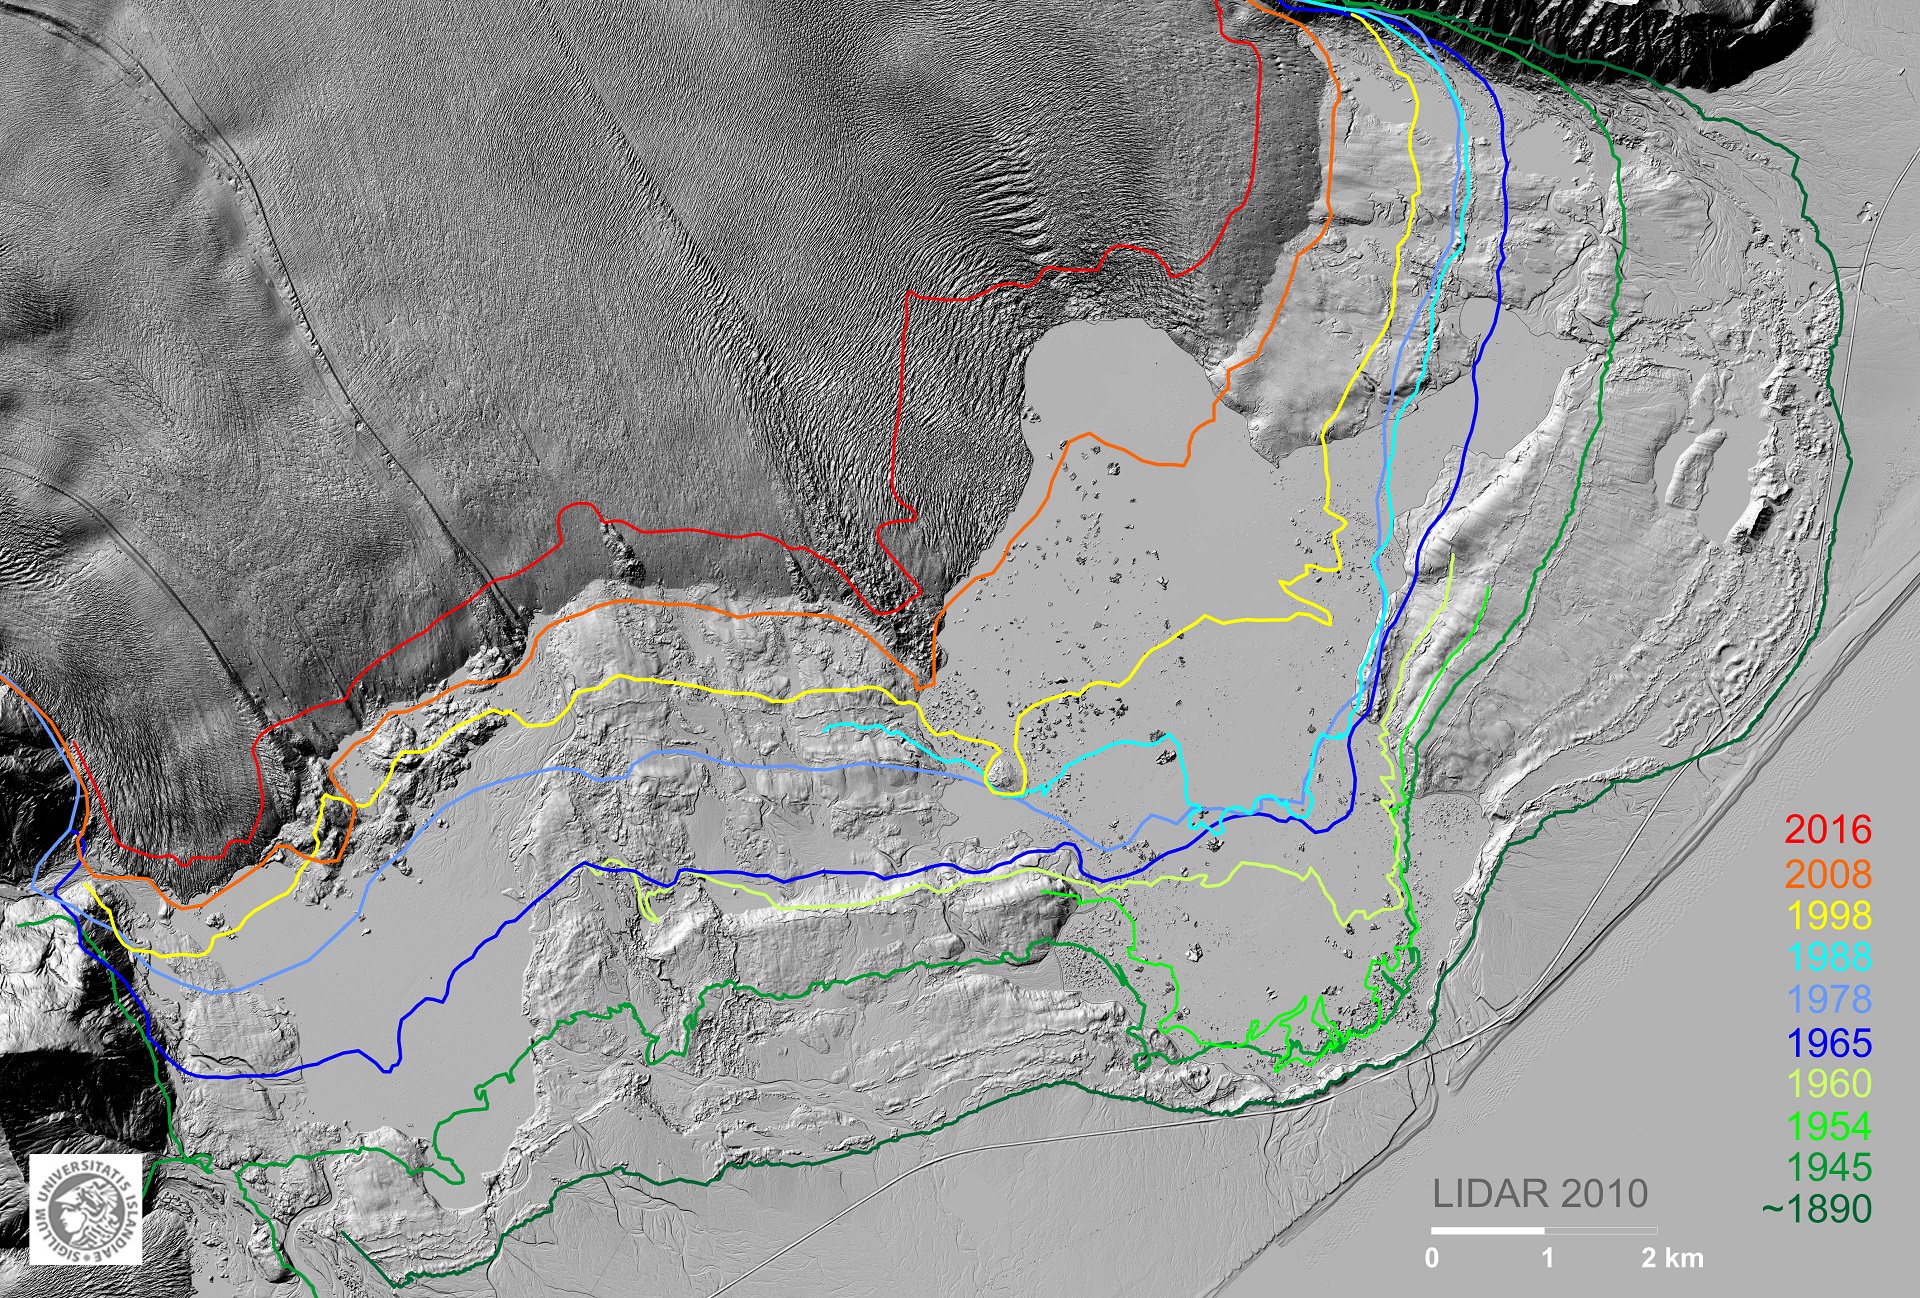
Fig. 14 The retreat of Breiðamerkurjökull and growth of Jökulsárlón glacial lake. Source: Glaciological Group of the Institute of Earth Sciences of University of Iceland.#
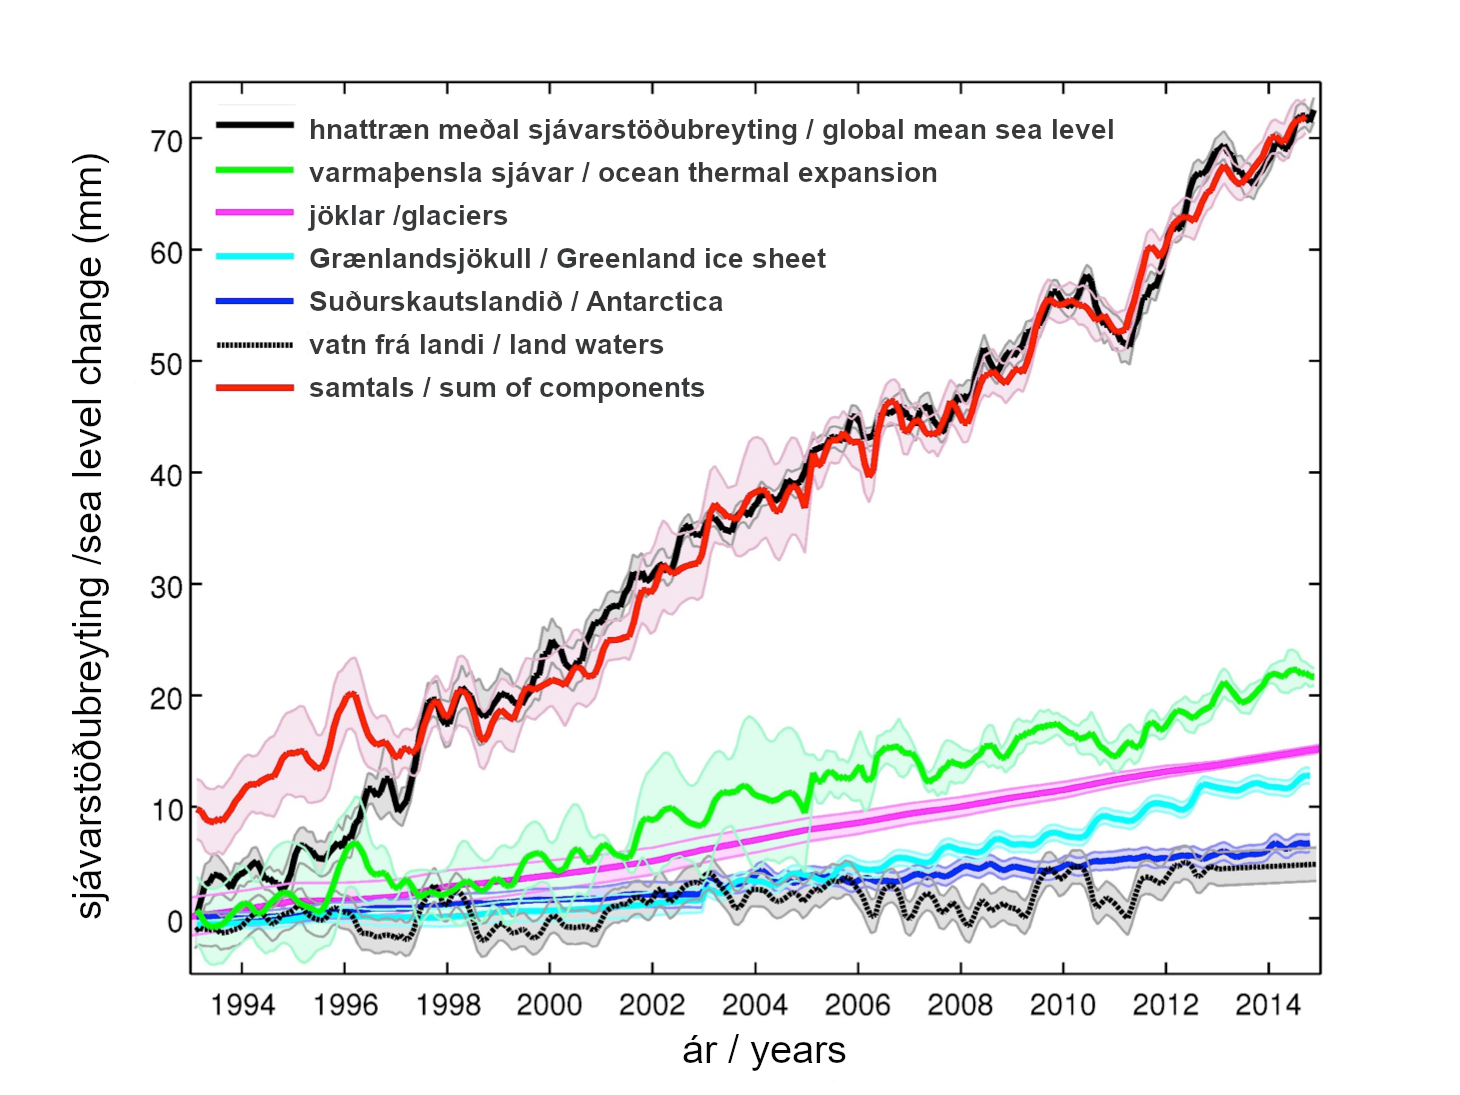
Fig. 15 Global sea level rise. Source: Björnsson et al. (2018)#
“The Antarctic Ice Sheet (AIS) is Earth’s largest freshwater reservoir, storing enough ice to add 58 m to global sea level if it all melted, with ~5.3 m from the West Antarctic Ice Sheet (WAIS) and the rest from the East Antarctic Ice Sheet.” - from Fricker et al. (2025)
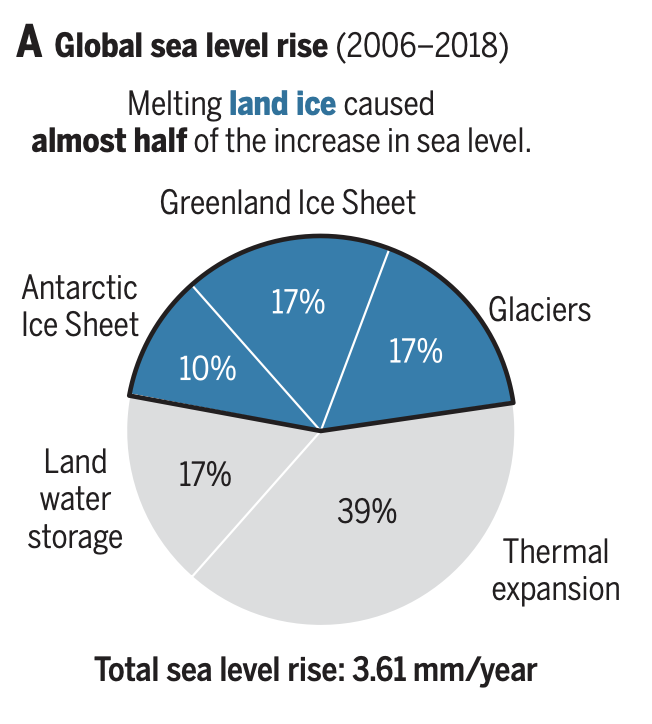
Fig. 16 Source: Fricker et al. (2025)#
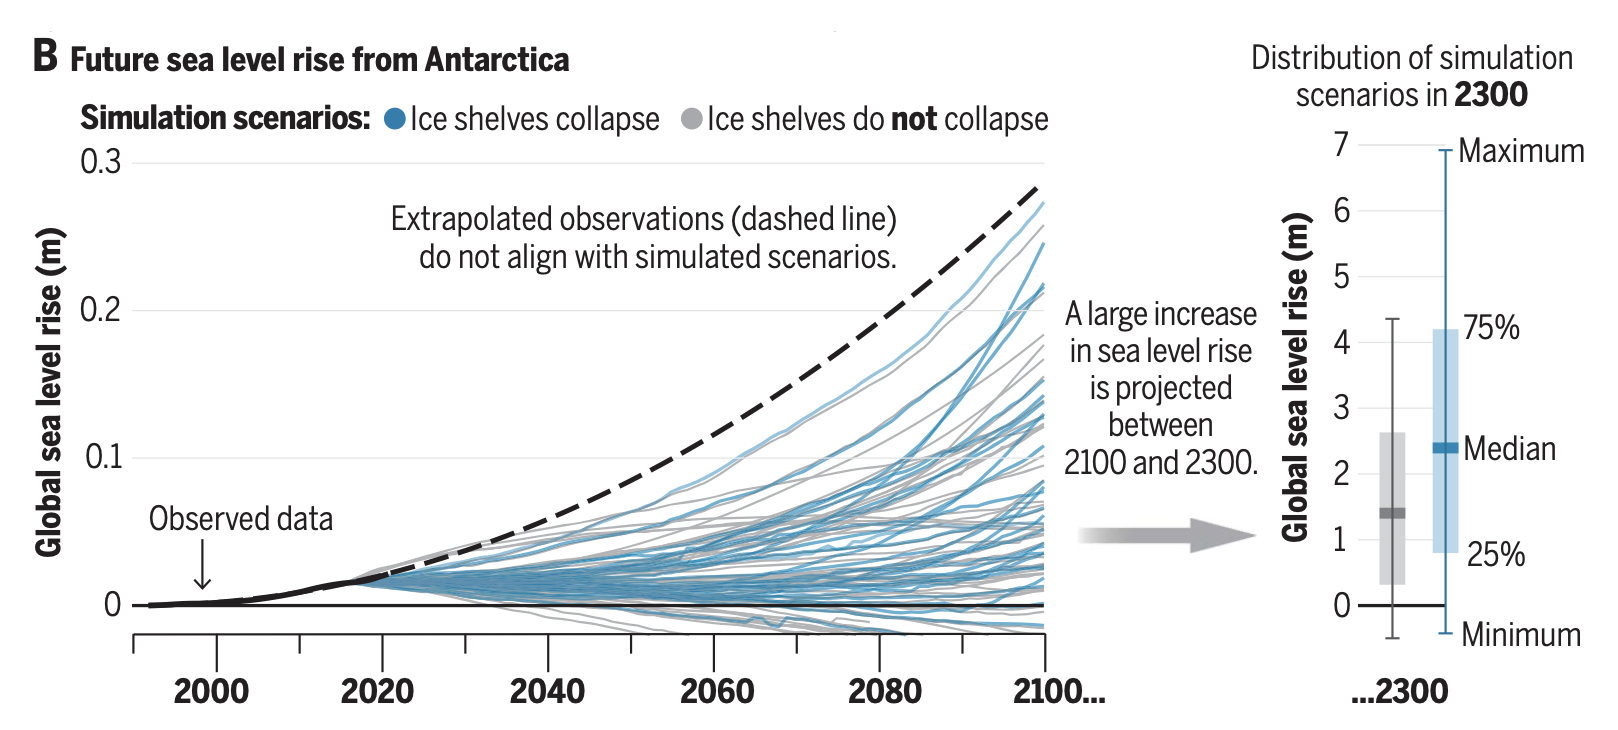
Fig. 17 Source: Fricker et al. (2025)#
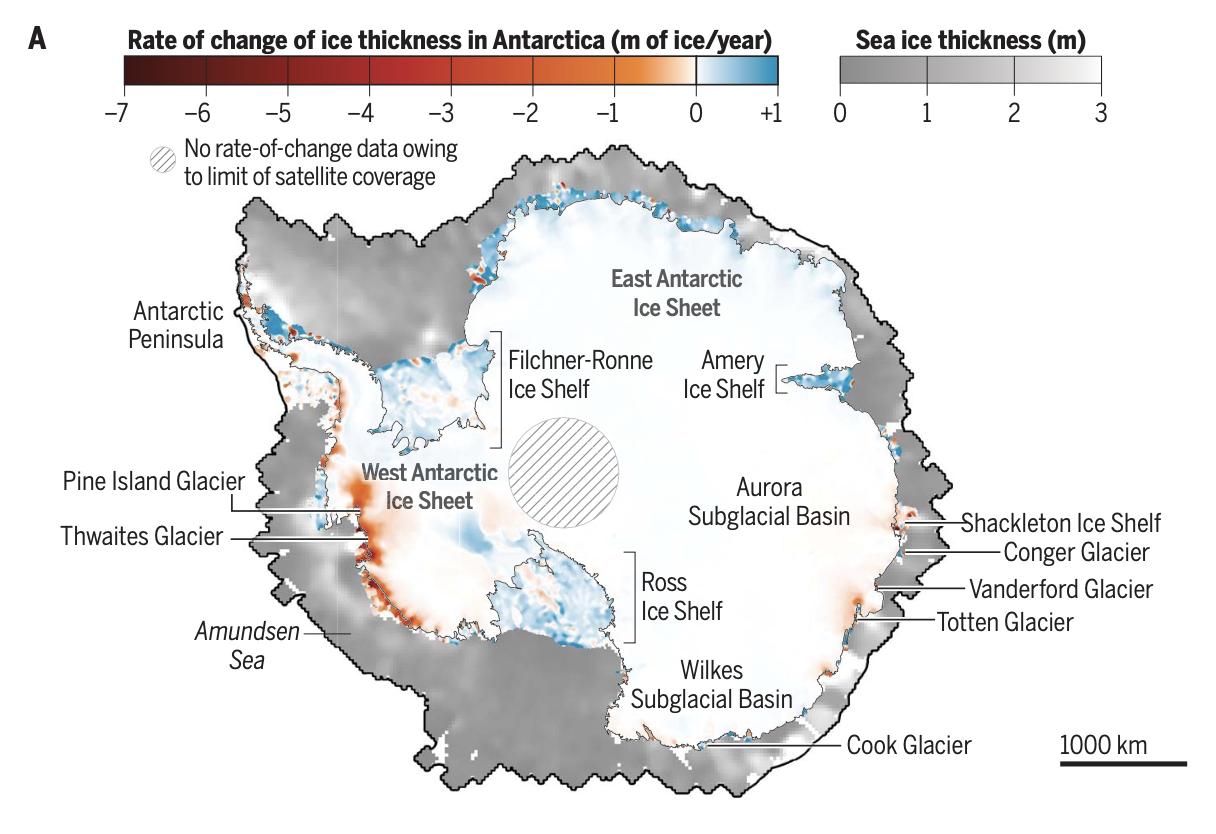
Fig. 18 Source: Fricker et al. (2025)#
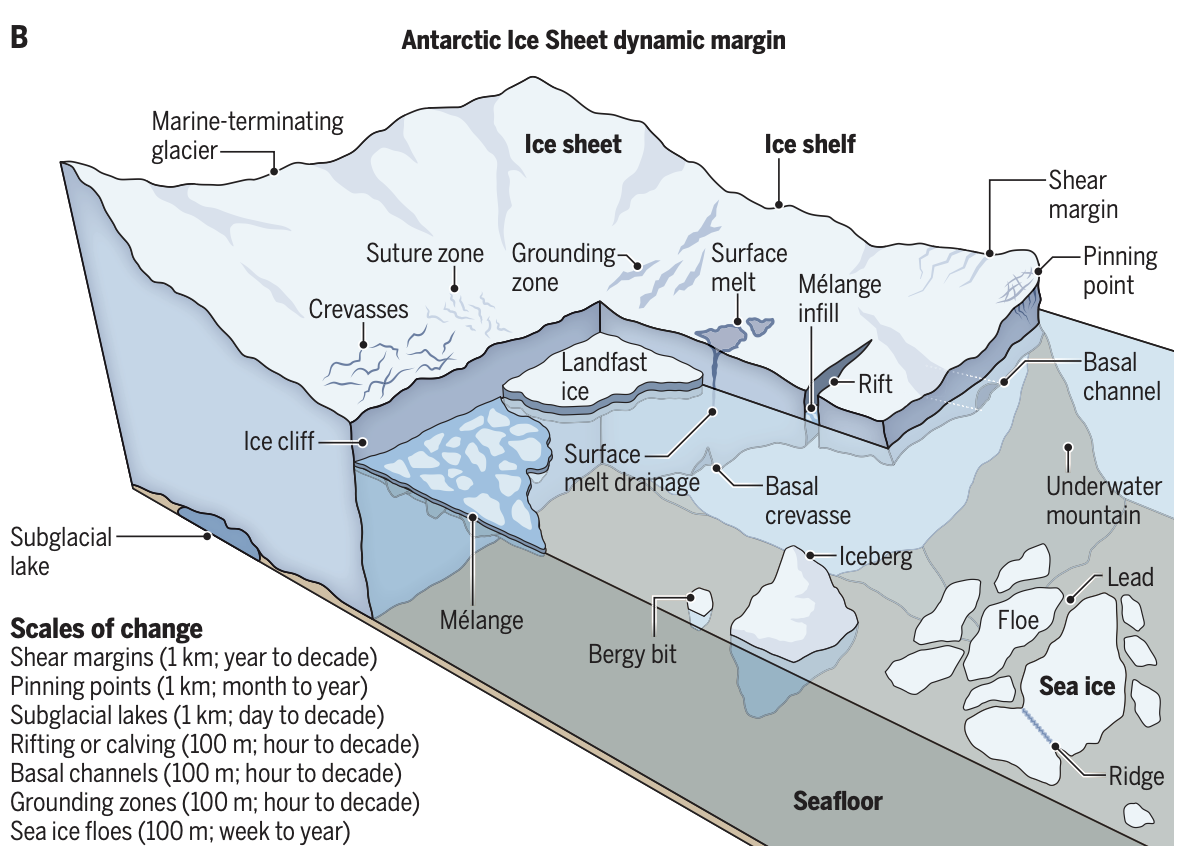
Fig. 19 Source: Fricker et al. (2025)#
Greenland glacier and natural variability#
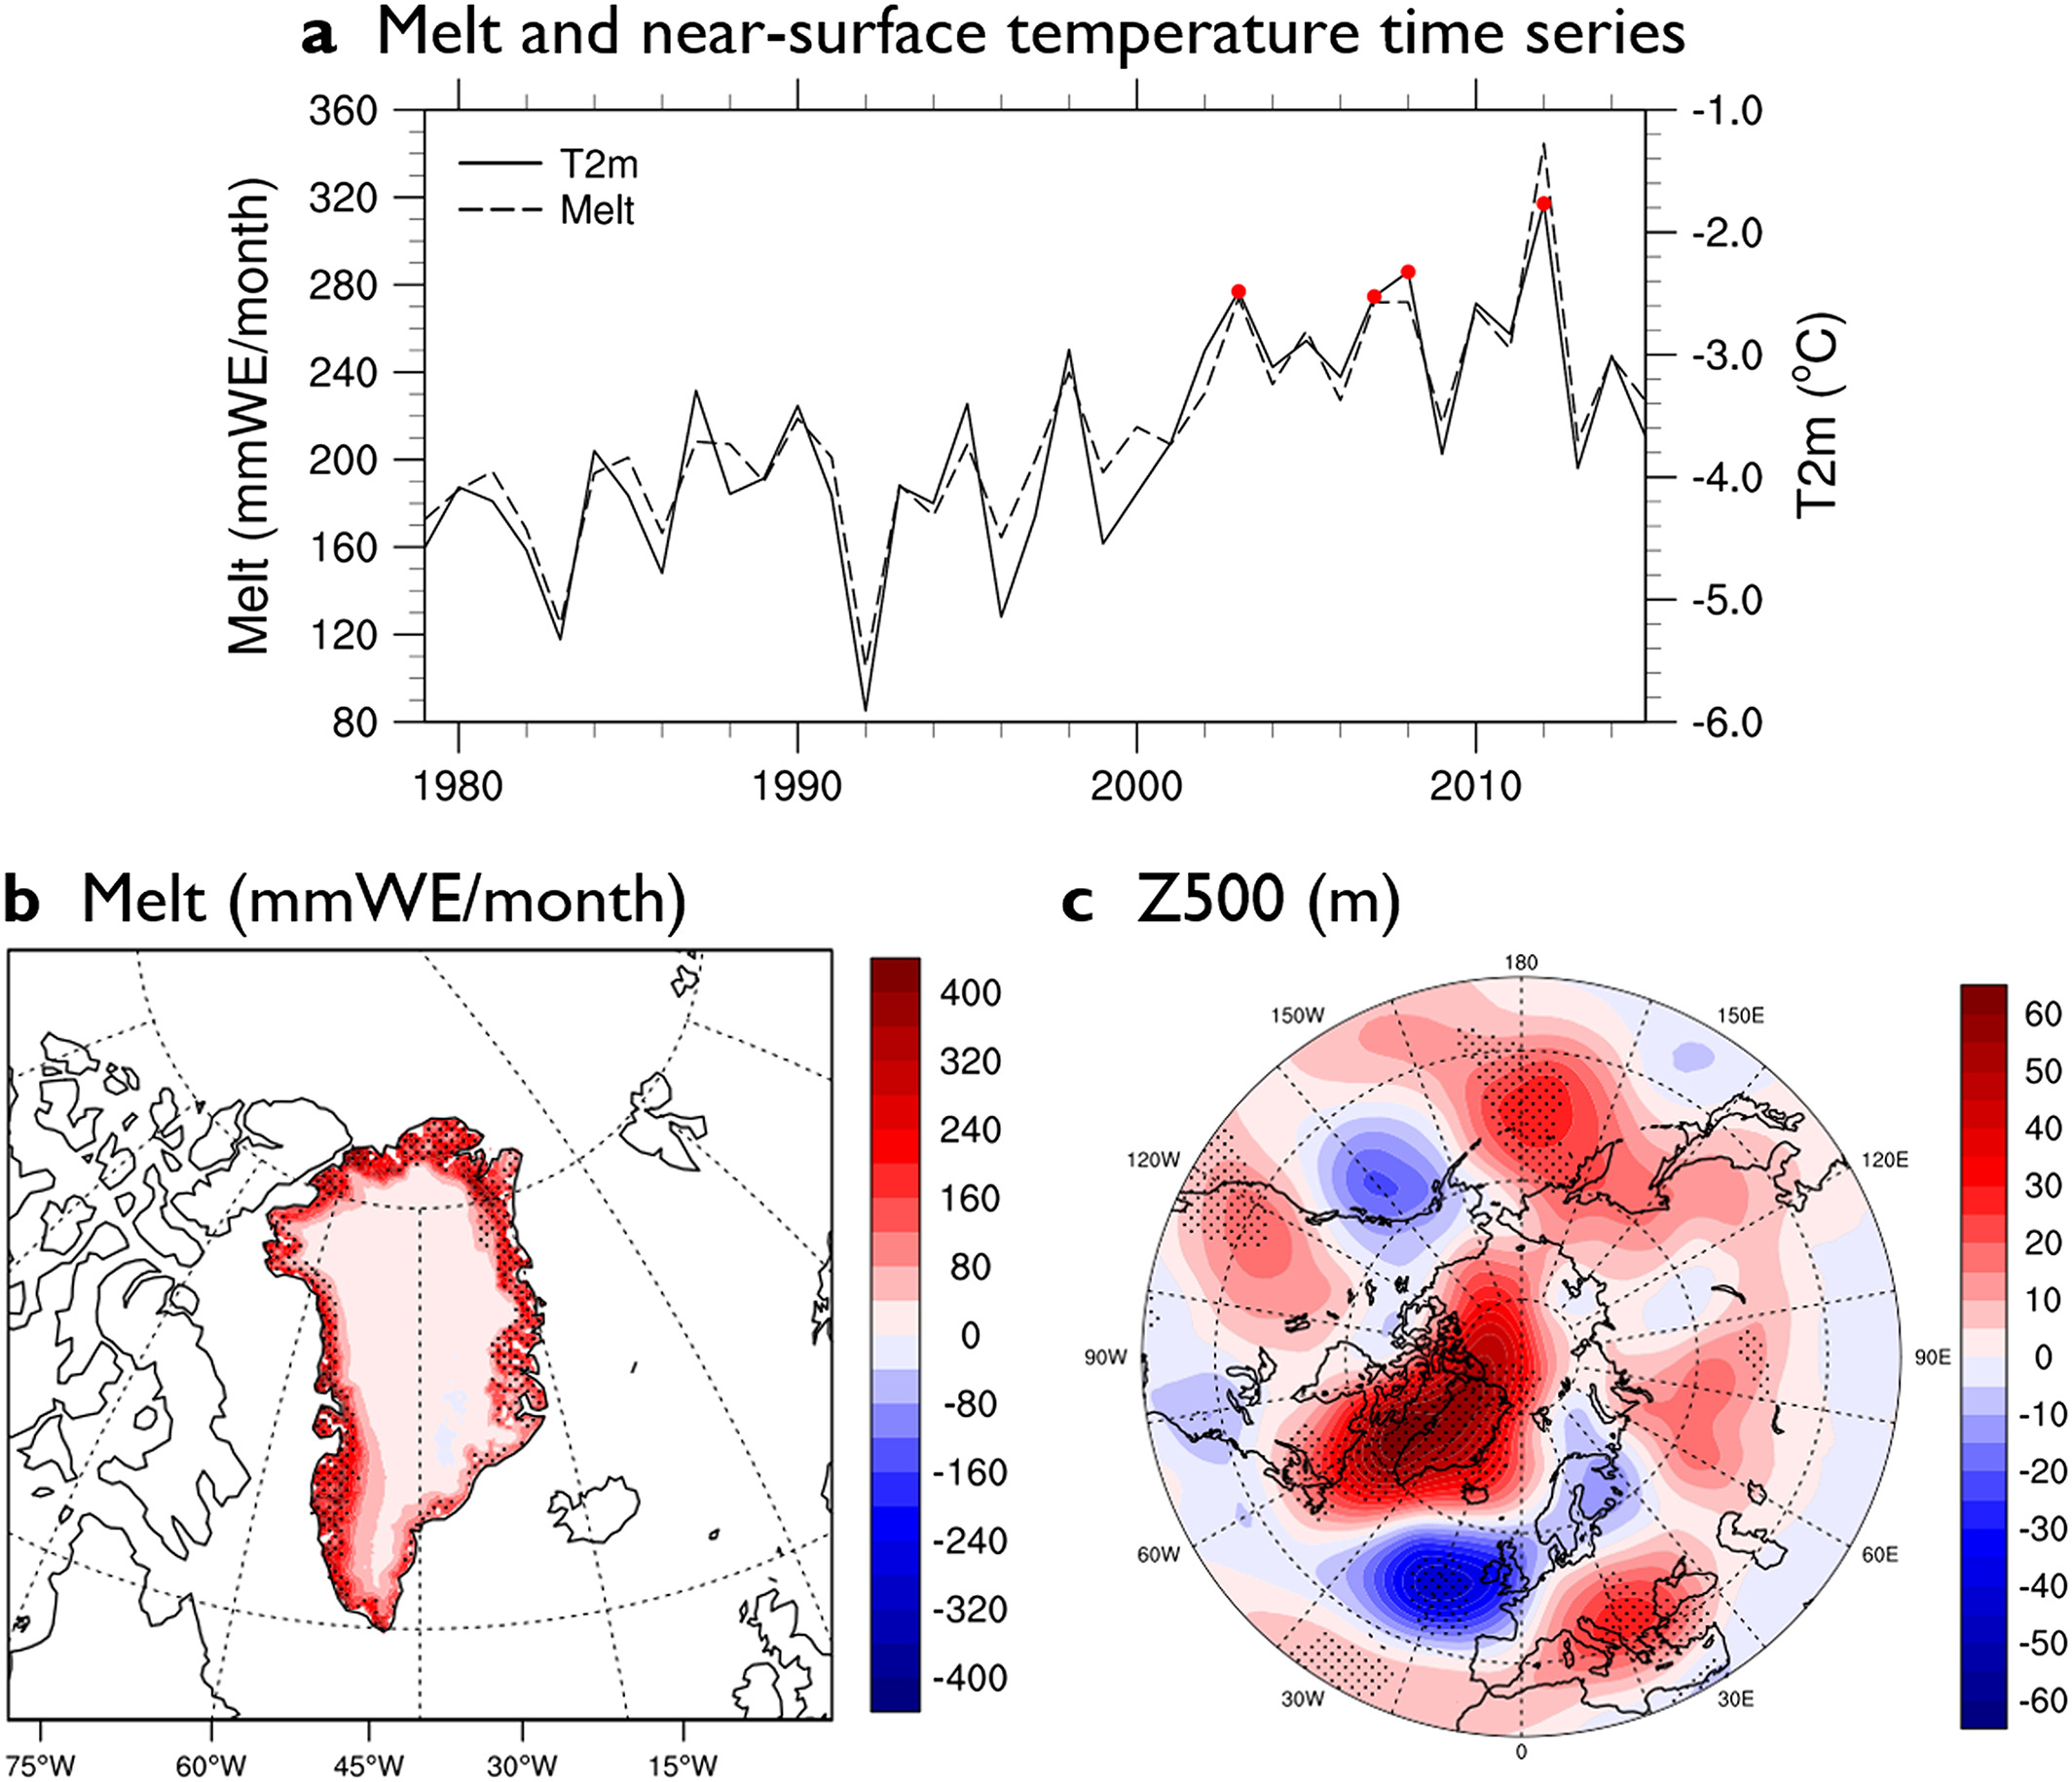
Fig. 20 (a) Time series of June–August (JJA) melt (mm water equivalent [mmWE]/month; dashed line) from the Modèle Atmosphérique Régional simulation and June–August near-surface temperature at 2-m height (T2m; °C; solid line) from ERA-Interim reanalysis averaged over Greenland for 1979–2015, with red dots indicating summers with extreme melt, defined as those with T2m in the top decile. JJA composite anomalies for top decile melt summers relative to the 1980–2009 mean for (b) melt (mmWE/month) and (c) Z500 (m). Stippling indicates anomalies statistically significant at the 95% confidence level. Figure from Hahn et al. (2018)#