A2. The History of Climate Modeling#
In this lecture, we briefly go over the history of climate modeling. I follow the timeline organized by a CarbonBrief online article and use materials from articles written by Dr. Yi-Hsuan Chen and Dr. Yen-Ting Hwang.
What is climate modeling?#
Ask ChatGPT:
Climate modeling is the use of mathematical models to simulate and understand the Earth’s climate system. These models are built using equations that represent the physical, chemical, and biological processes that govern climate dynamics. By incorporating key elements such as the atmosphere, oceans, land surface, ice, and human influences, climate models help scientists study past, present, and future climate conditions.
Key Components of Climate Models
Atmospheric Dynamics: Movements of air, heat, and moisture through processes like wind, convection, and cloud formation.
Ocean Dynamics: Currents, heat exchange, and the movement of salinity within the ocean.
Land Surface: The effects of vegetation, soil moisture, and albedo (reflectivity) on climate.
Cryosphere: The role of ice sheets, glaciers, and sea ice in reflecting sunlight and regulating heat.
Radiative Transfer: The movement of solar and terrestrial radiation, influencing temperature and weather patterns.
Greenhouse Gas Emissions and Aerosols: The role of CO2, methane, and other pollutants in warming or cooling the atmosphere.
Types of Climate Models
Simple Climate Models: Often used for specific questions, these models simplify the system, focusing on just a few elements like temperature and carbon cycle dynamics.
General Circulation Models (GCMs): Complex three-dimensional models that simulate the entire climate system, including interactions between the atmosphere, oceans, land surface, and ice.
Earth System Models (ESMs): Advanced GCMs that also include processes like the carbon cycle, biogeochemistry, and the role of vegetation and ecosystems.
Purposes of Climate Modeling
Understanding Climate Change: Models help predict how the Earth’s climate will respond to increasing greenhouse gas concentrations, enabling scientists to project future temperature rise, sea-level changes, and extreme weather events.
Paleoclimate Studies: By modeling past climates, scientists can understand how the Earth’s climate has changed over millennia and how it might behave in the future.
Scenario Planning: Climate models are used to test different policy scenarios, such as reducing carbon emissions, and their potential impacts on global and regional climates.
Short-Term Forecasting: Seasonal and decadal climate models can predict patterns like El Niño, monsoons, or droughts.
Limitations of Climate Models
Resolution: Models often have a coarse resolution, making it difficult to simulate fine-scale processes like local weather patterns or regional topography.
Uncertainty: There is inherent uncertainty in projections due to unknown future human activities, natural variability, and incomplete understanding of certain climate processes.
Complex Interactions: The climate system is highly complex, and not all interactions—especially those involving clouds, aerosols, and ocean circulation—are fully understood.
Note
George E. P. Box (statistician): Essentially, all models are wrong, but some are useful.
A minimal definition of a climate model by Professor Brian E. J. Rose:
A representation of the exchange of energy between the Earth system and space, and its effects on average surface temperature.
What is the average? And the planetary energy budget is the to all climate modeling.
1896 - Svante August Arrhenius#
Wikipedia link: here
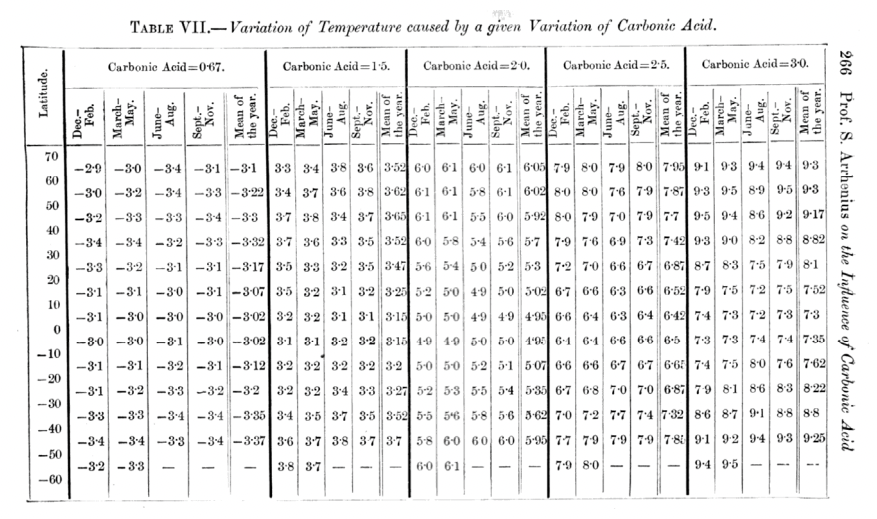
On the Influence of Carbonic Acid in the Air upon the Temperature of the Ground (here)
Fourier (1827)
Pouillet (1838)
Tyndail (1865)
Langley (1884, 1890)
In particular, Arrhenius’ Table VII impressed me most becasue it shows polar amplified temperature increase:
1904 - Vilhelm Bjerknes#
Wikipedia link: here
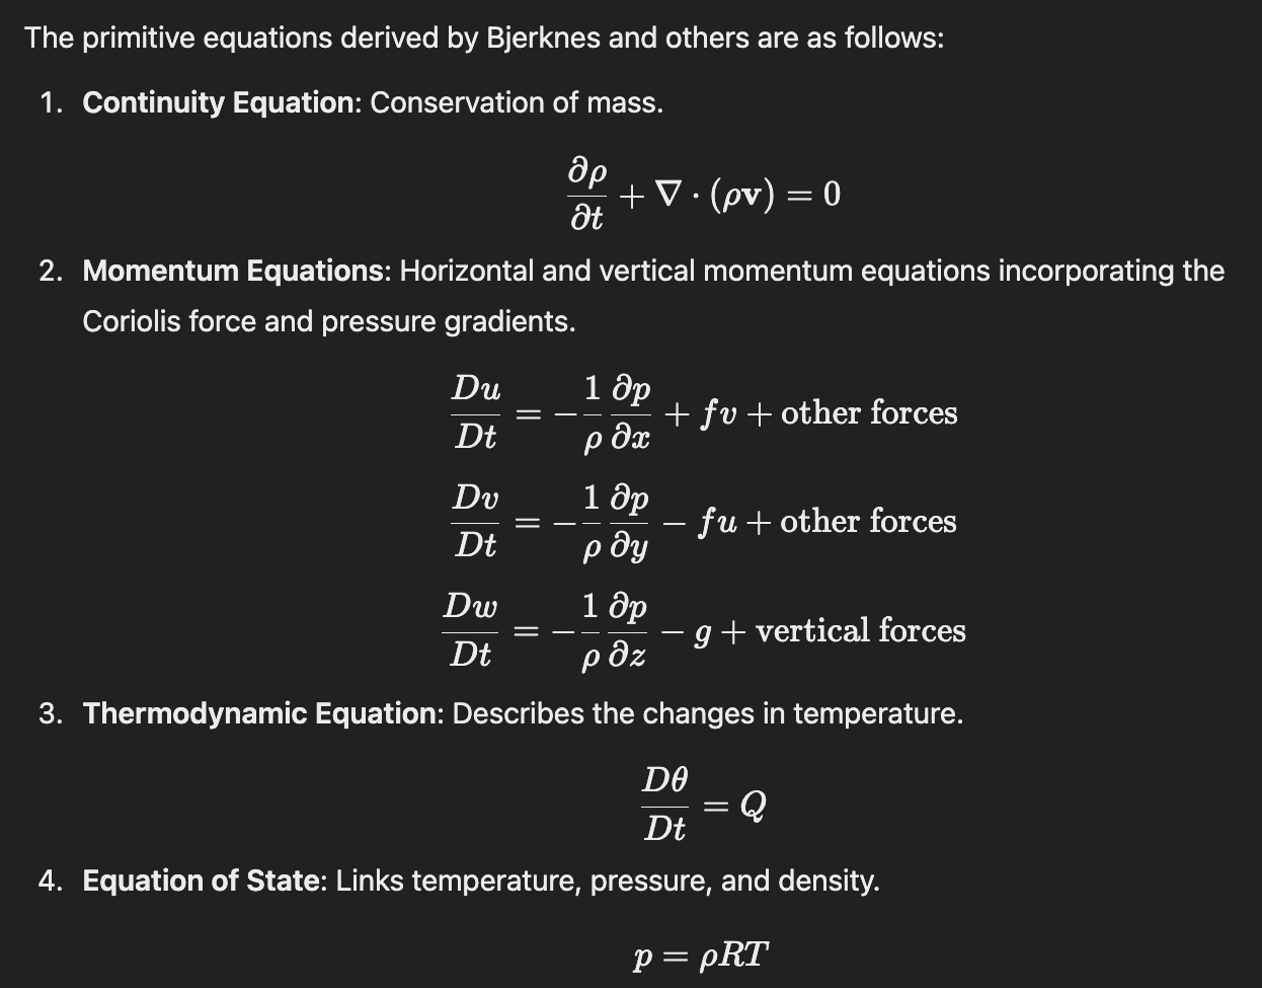
Das Problem der Wettervorhersage, betrachtet von Standpunkt der Mechanik und Physik
“Atmospheric changes could be calculated from a set of seven “primitive equations”. CarbonBrief
Ask ChatGPT:
Jacob Bjerknes - ENSO
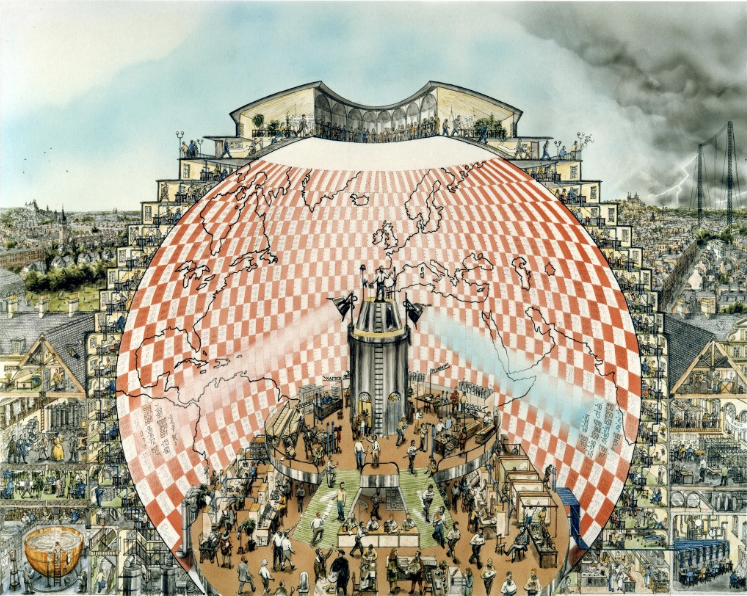
1922 - Lewis Fry Richardson#
Began climate modelling using numerical methods.
It took him six weeks to produce an eight-hour forecast.
“Weather Forecasting Factory” by Stephen Conlin (1986, here):
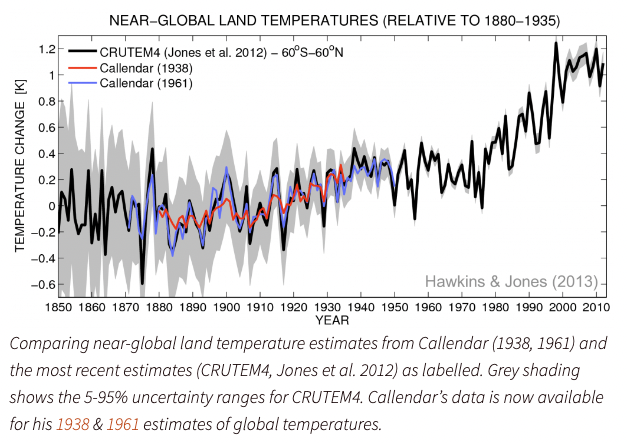
1938 - Guy Callendar#
He used a 1D radiative transfer model to show warming by rising CO2 levels.
He did all the calculations by hand.
The artificial production of carbon dioxide and its influence on temperature
A later paper (Hawkins and Jones, 2013) reproduced Guy Callendar’s results and Ed Hawkins’ article:
1946 - John von Neumann#
He proposed that new computers, such as the ENIAC at the University of Pennsylvania, can be used to forecast weather.
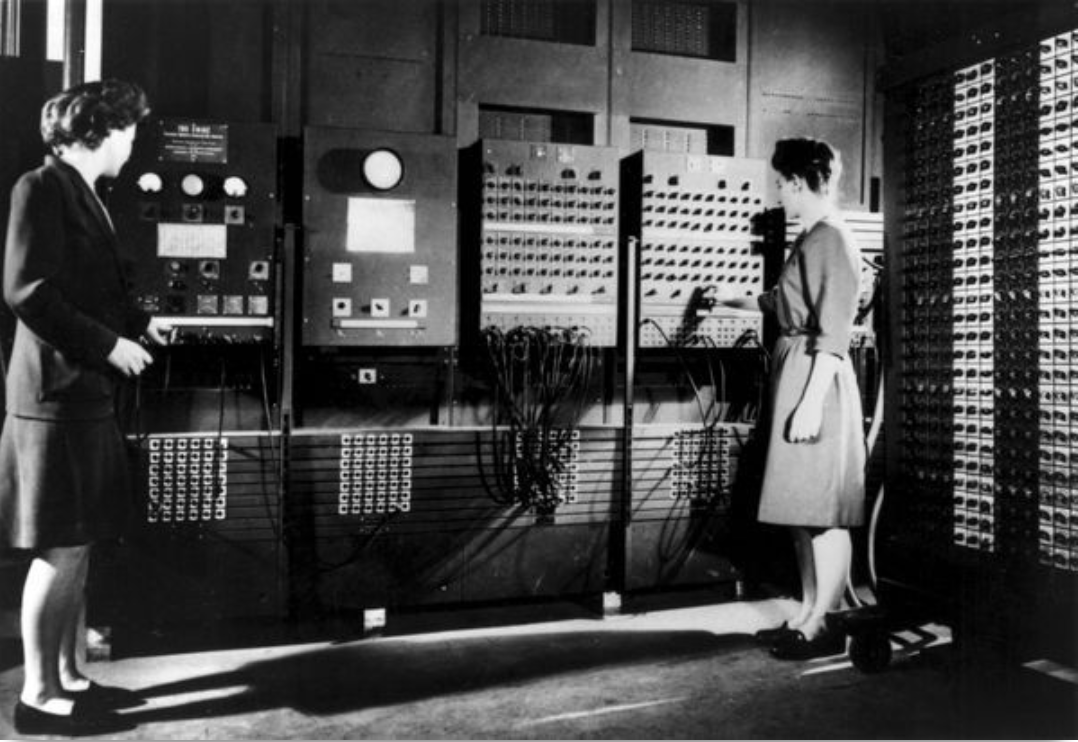
1950 - ENIAC#
completed in 1945, put to work on December 10, 1945, and retired at 11:45 p.m. on October 2, 1955
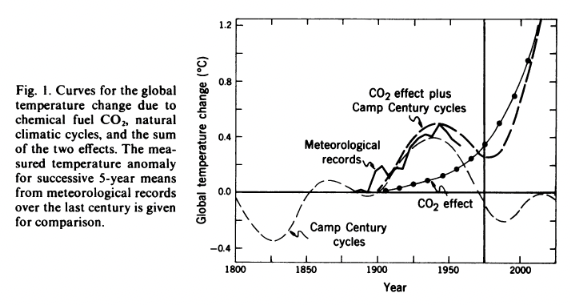
1953 - Gilbert Plass#
The warming influence of human-caused CO2 emissions
Time magazine: here
1954 - JNWPU and BESK#
Joint Numerical Weather Prediction Unit (JNWPU) July 1, 1954 (Jule Gregory Charney?)
Binary Electronic Sequence Calculator (BESK) - December, 1954 (Carl-Gustav Rossby)
1955 - Joseph Smagorinsky#
General Circulation Research Section under both von Neumann and Charney.
to create a 3D general circulation model (GCM) of the global atmosphere based on “primitive equations”.
the General Circulation Research Laboratory in 1959.
the Geophysical Fluid Dynamics Laboratory (GFDL) in 1963.
a paper later by Norman Phillips 1956 - the first GCM: here and here, a 2-layer, hemispheric, quasi-geostrophic computer model.
1956 - Mikhail Budyko#
He used a simple energy-balance model, and calculated the Earth’s average global temperature by balancing incoming solar energy with outgoing thermal energy.
1956 - Syukuro Manabe#
Smagorinsky invited Syukuro Manabe from the University of Tokyo to join his lab at the US Weather Bureau.
They work together to gradually add complexity to the models.
1956 - Norman Phillips#
1963 - Fritz Möller#
To disprove Gilbert Plass’s influential 1953 paper on the warming influence of human-caused CO2 emissions.
He ignored certain physical processes such as atmospheric convection, but encouraged other researchers (Manabe and Wetherald in 1967) to develop more reliable climate models.
1964 - Akio Arakawa#
Mintz-Arakawa Model can run longer!!!
Additional adevection term to represent grid-scale subgrid-scale interactions.
1964 - NCAR#
Warren Washington and Akira Kasahara
NCAR as a leading climate modelling centre from the 1960s onwards.
1966 - National Academy of Science#
the modellers need more powerful, faster computers
1967 - Kirk Bryan#
the first ocean general circulation model
A numerical investigation of the oceanic general circulation
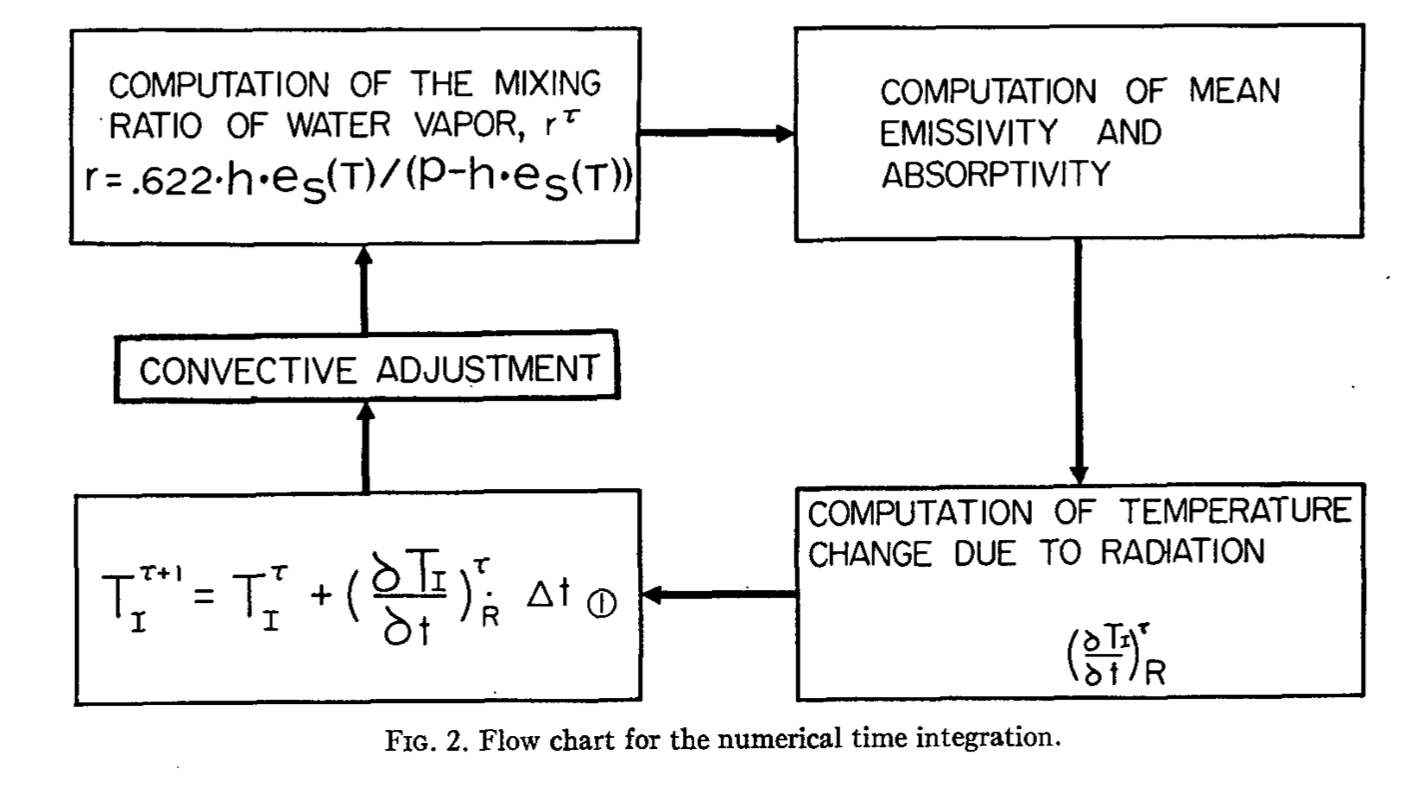
1967 - Manabe and Wetherald#
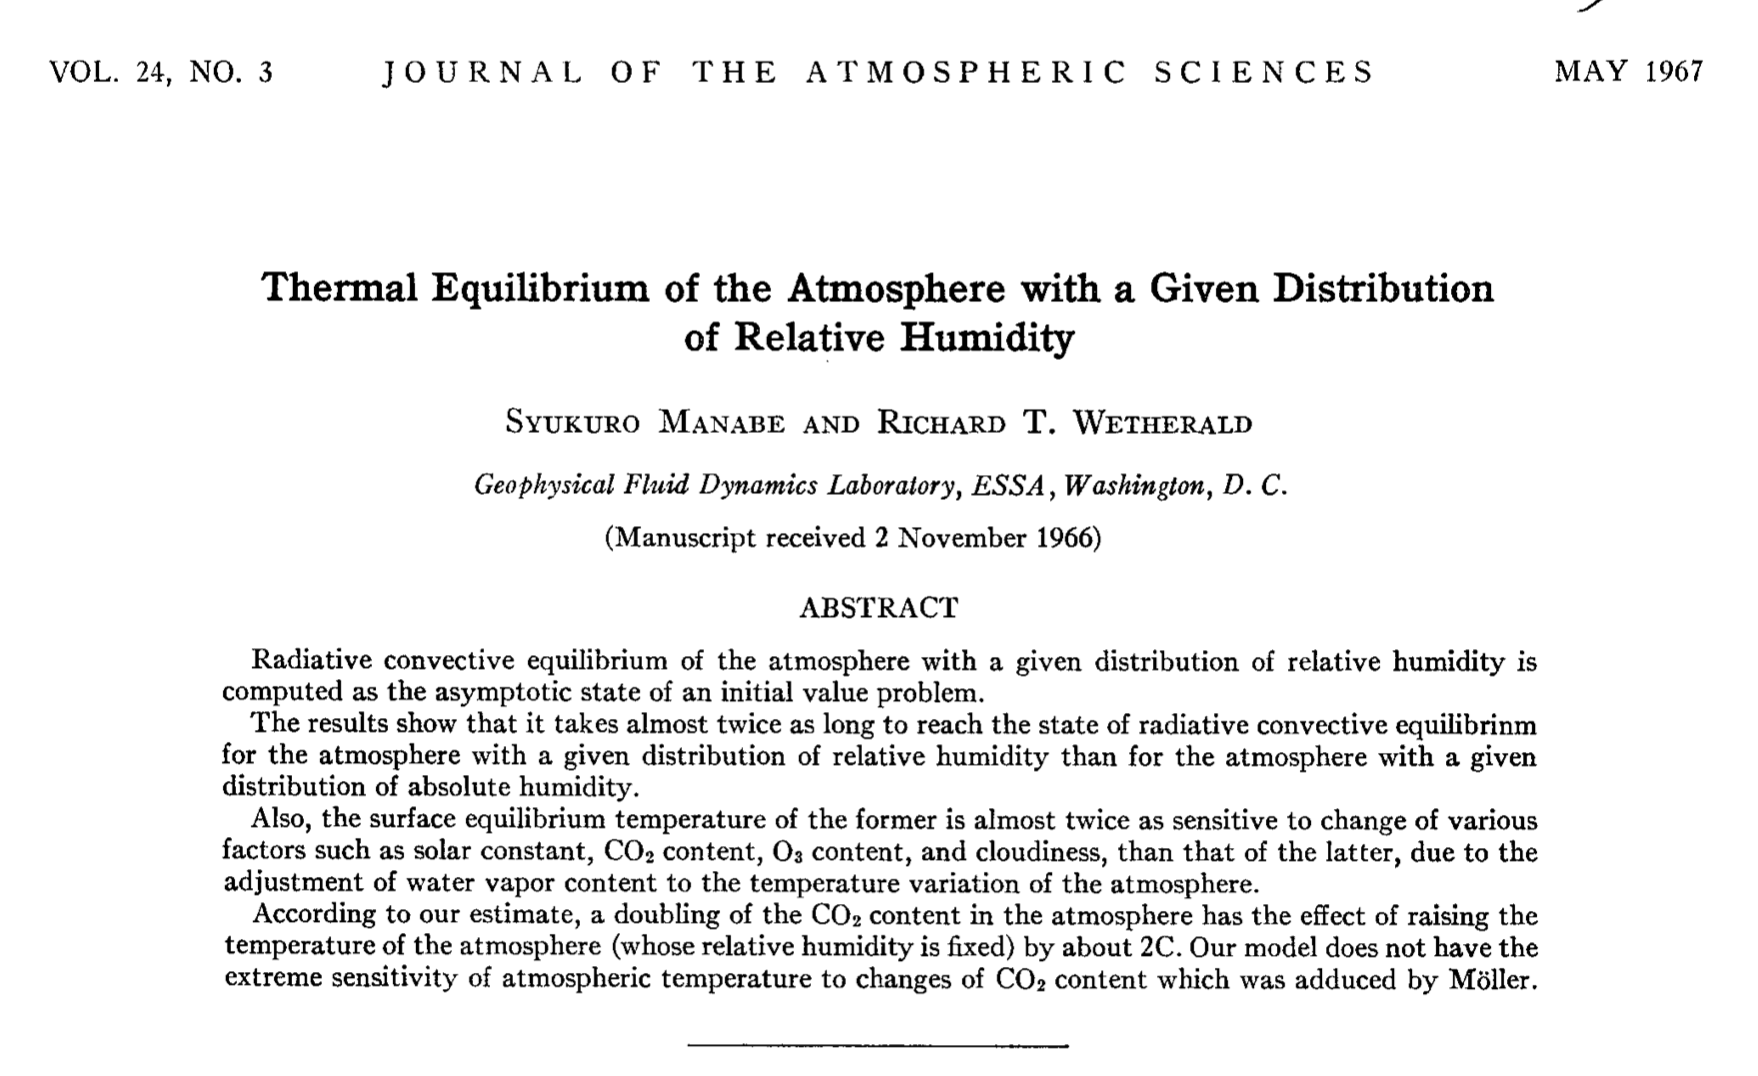
Thermal Equilibrium of the Atmosphere with a Given Distribution of Relative Humidity
They produced the first credible prediction, using a 1D radiative-convective model, of what would happen to the atmosphere if CO2 levels were changed.
“what will happen to the global average temperature if the radiative transfer of energy between the surface and the troposphere is altered by an increase in CO2 levels?” CarbonBrief.
“they want to know what the potential feedbacks from water vapour and clouds might be, which they discover strongly influence the CO2 effect.” CarbonBrief
“They estimate the effect of doubling CO2 levels – a metric which later becomes known as “climate sensitivity” – and settle on a value of 2.4C.” CarbonBrief
A post by Professor John Mitchell: here
An interview with Syukuro Manabe: here
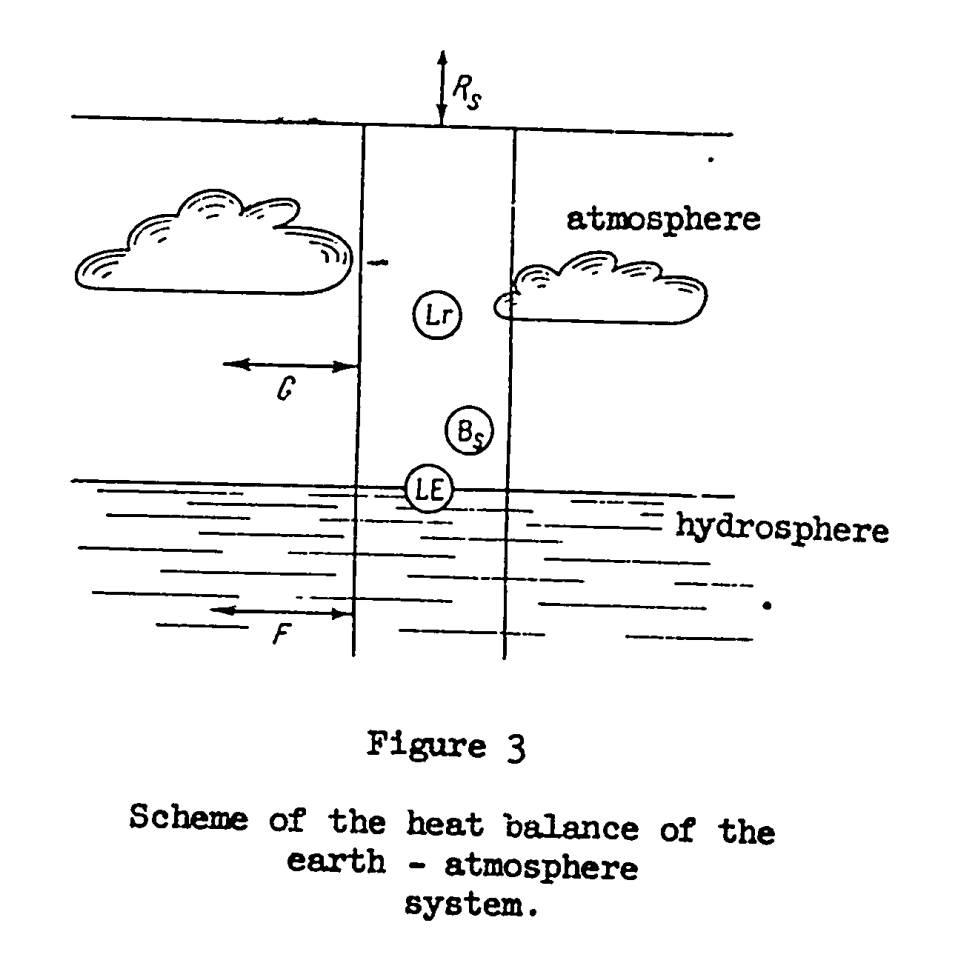
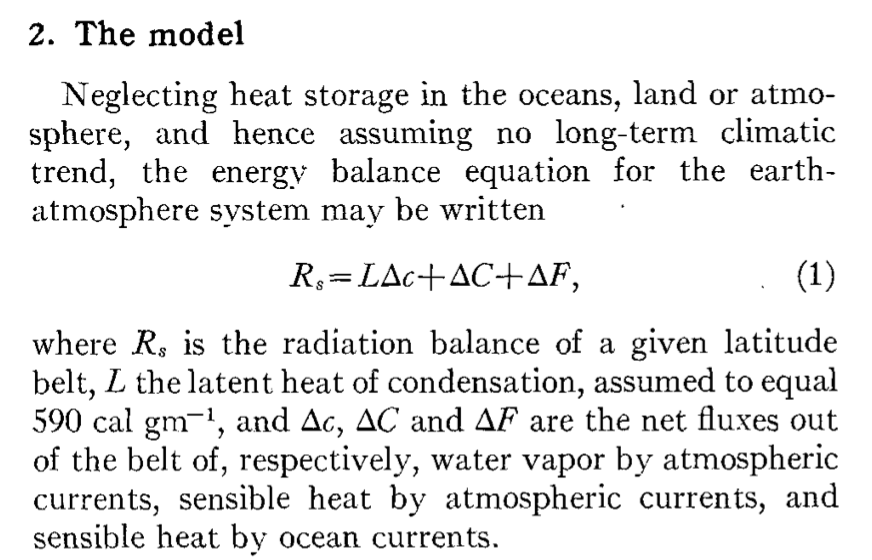
1969 - William D Sellers#
A Global Climatic Model Based on the Energy Balance of the Earth-Atmosphere System
I think Sellers’ model is a prototype of (moist) energy balance model.
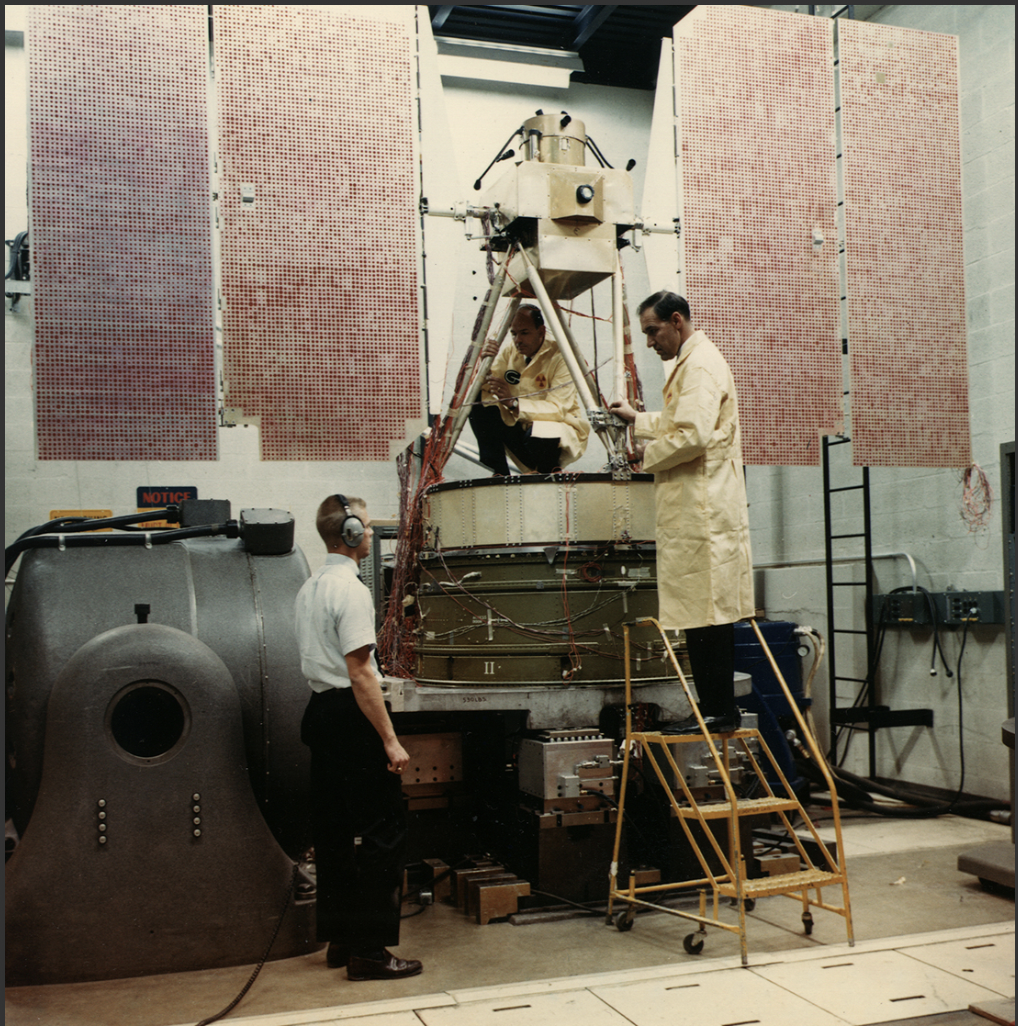
1969 - Nimbus3#
NASA’s Nimbus3 satellite was launched April 14, 1969 (here).
The era of climate scientists relying on satellite data to test and validate their models has begun.
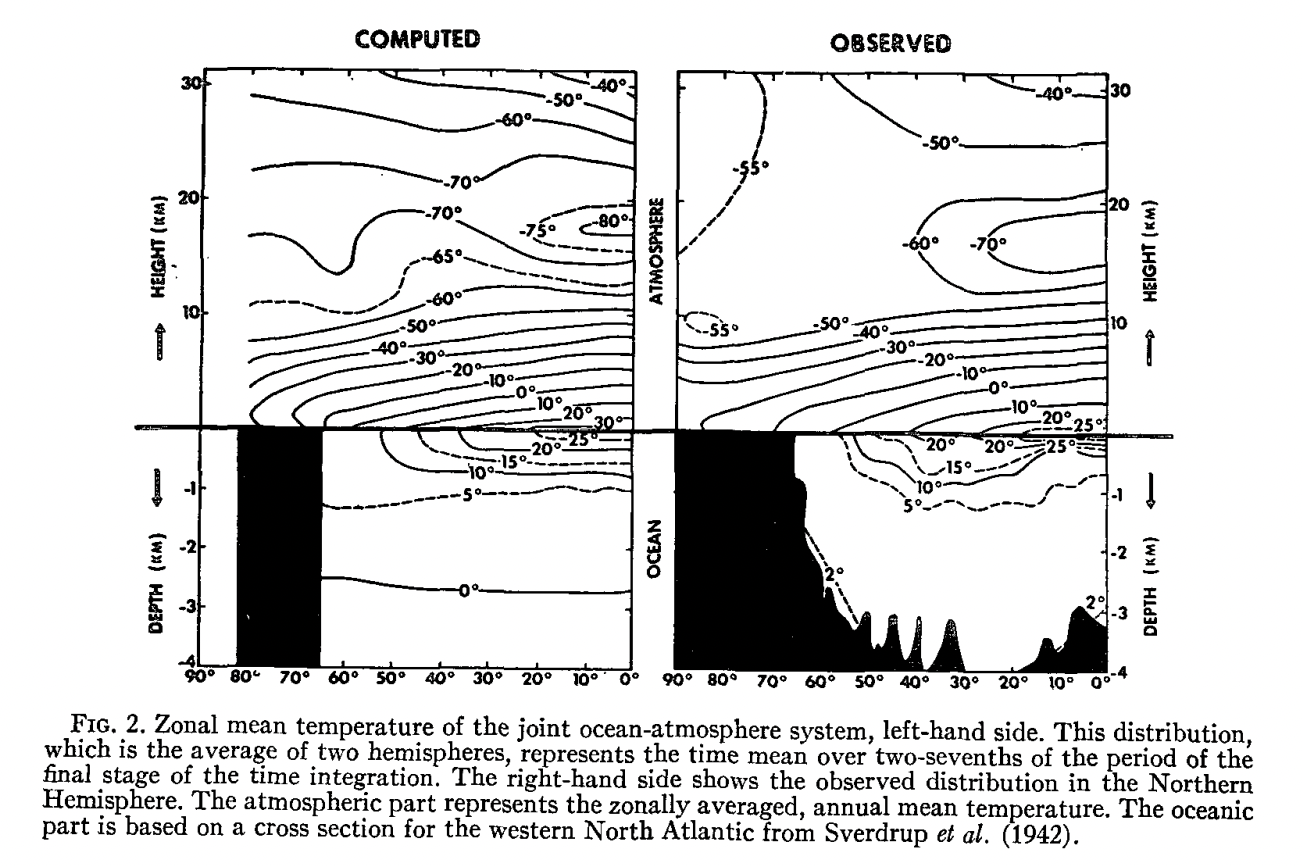
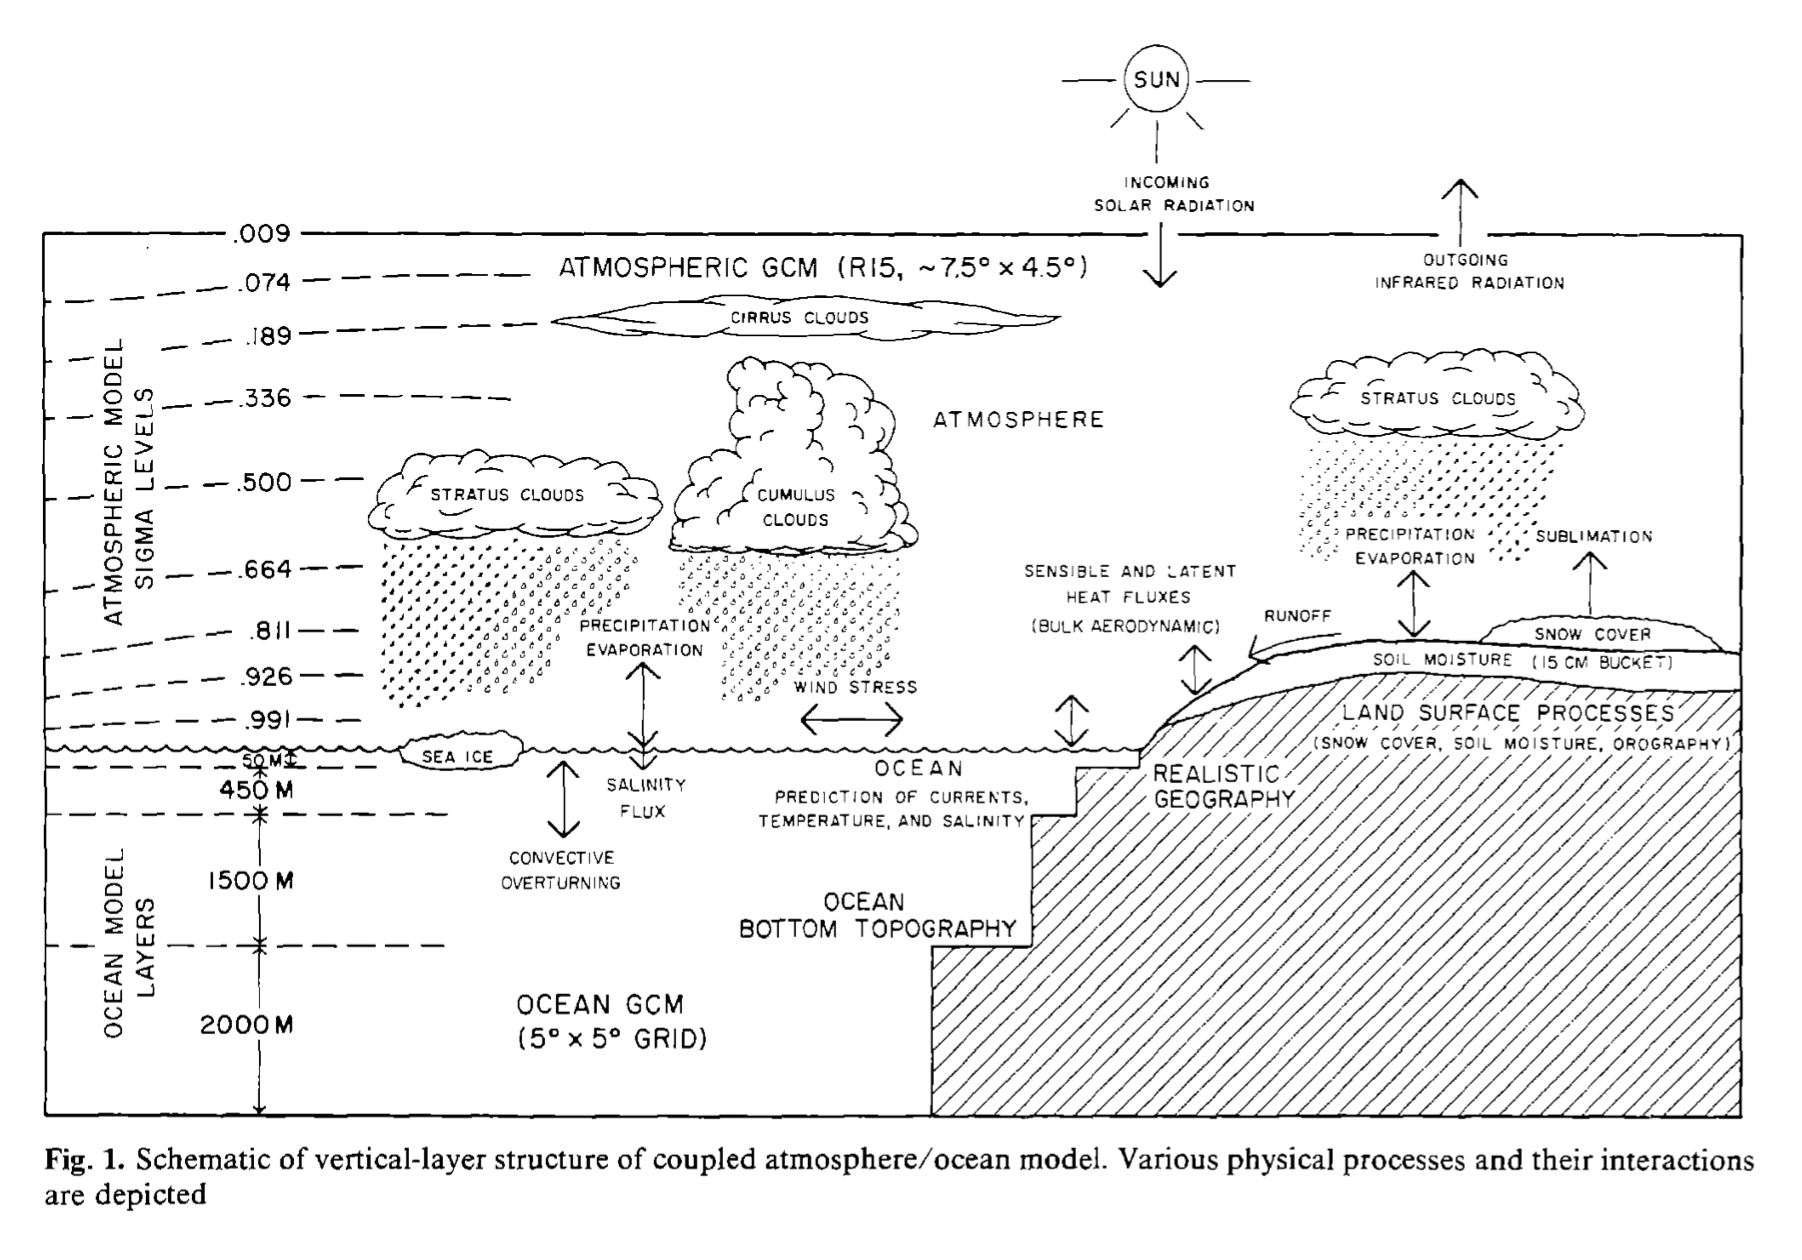
1969 - Manabe and Bryan#
the first “coupled” atmosphere-ocean GCM
The computing time issue: it takes 1,100 hours (about 46 days) to do just one run of the model.
Simplified land and ocean domains.
1970 - two meetings on human’s impact on climate#
1970 - NOAA#
President Richard Nixon: “serve a national need for better protection of life and property from natural hazards…for a better understanding of the total environment”.
1972 - the United Nations Conference on the Human Environment#
the UN Environment Program.
Human-caused climate change is now turn to the radar of politicians.
1972 - UK Met Office#
The first UK coupled GCM, developed since 1963.
They used the UK-based ATLAS computer, led by George Corby.
Five-layer atmospheric GCM
A general circulation model of the atmosphere suitable forlong period integrations
A numerical experiment using a general circulation modelof the atmosphere
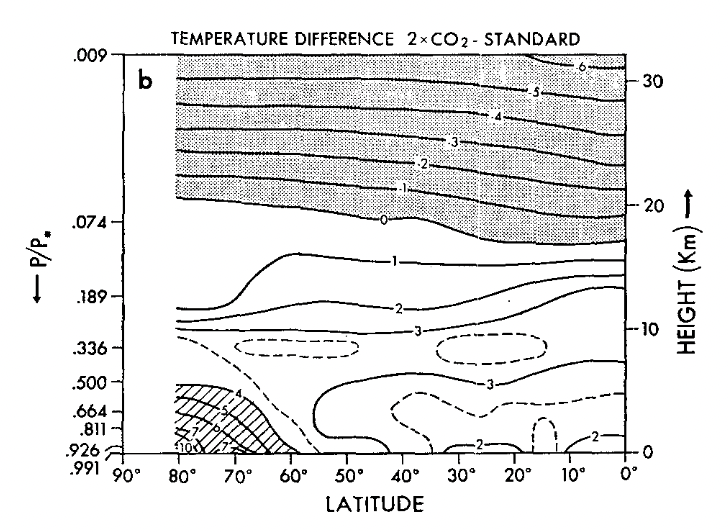
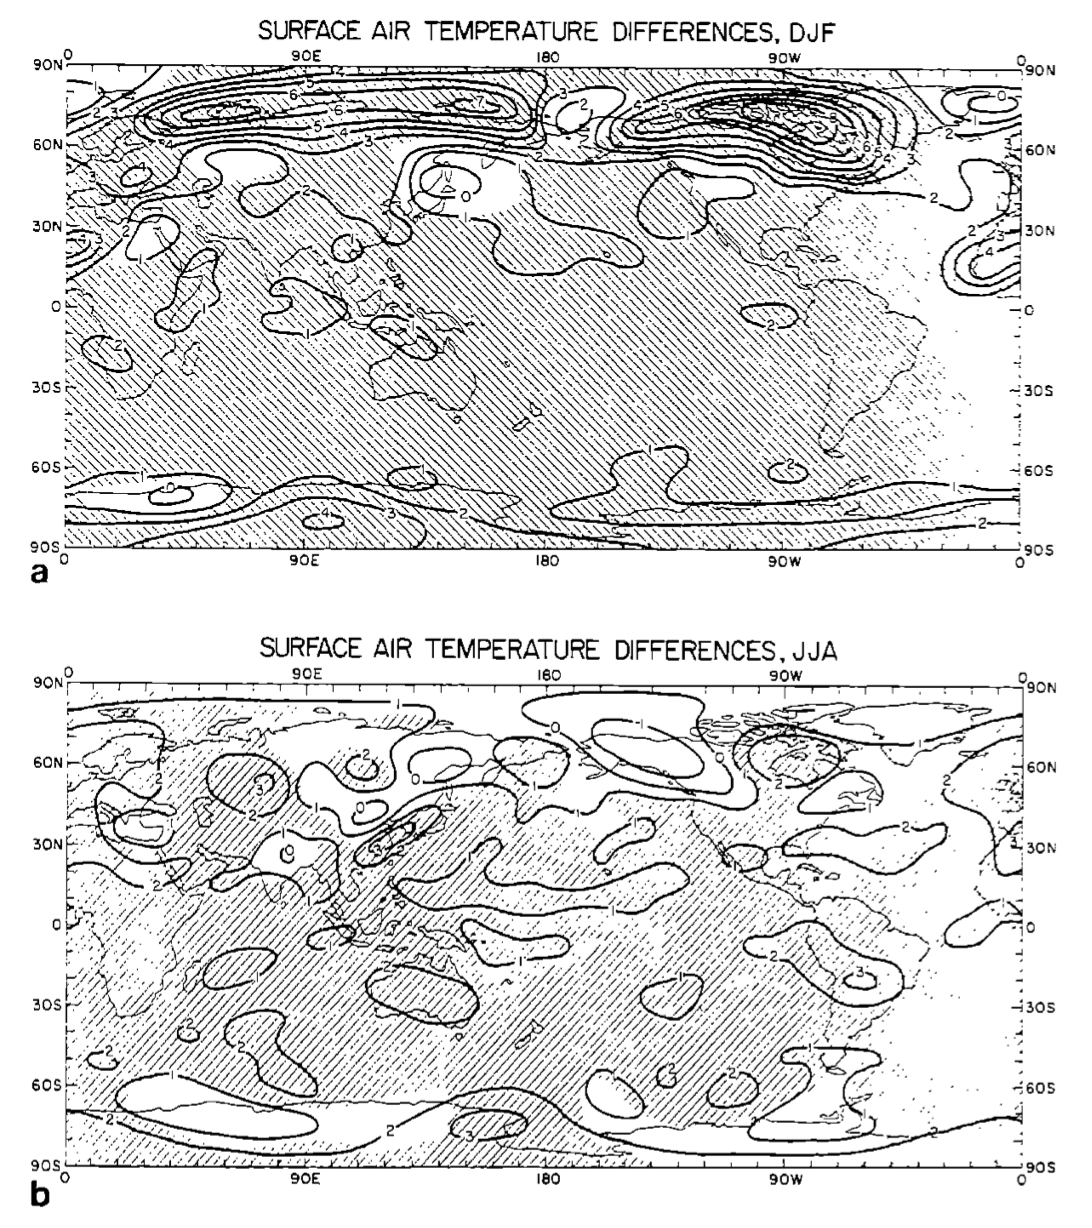
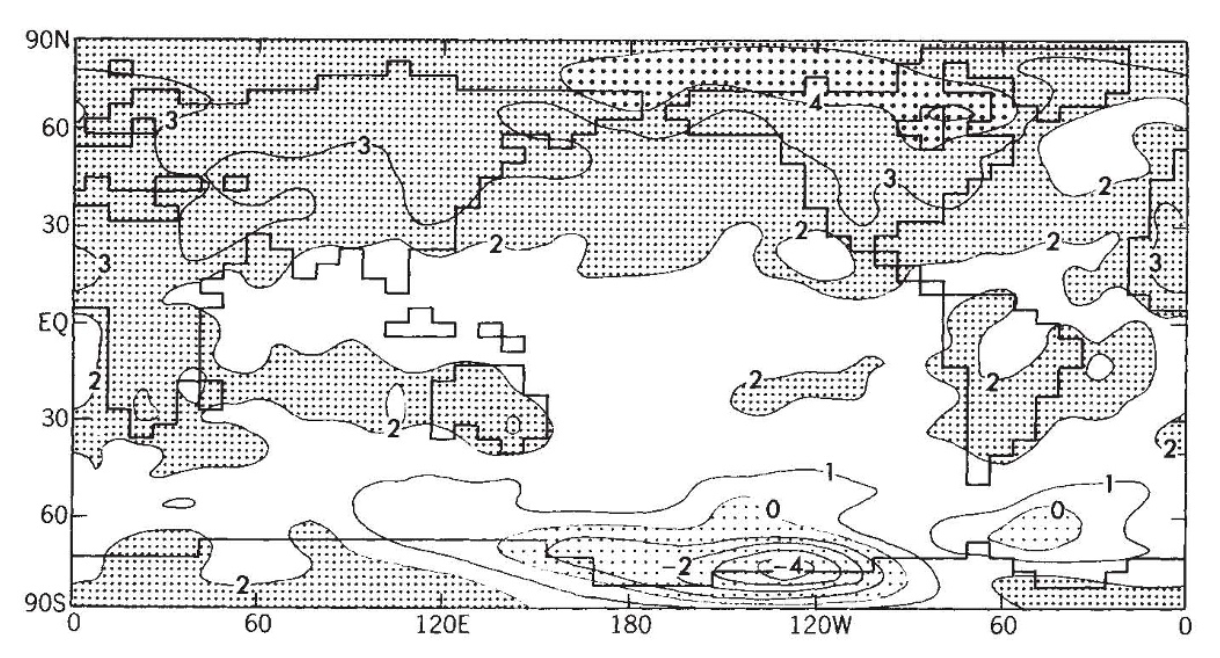
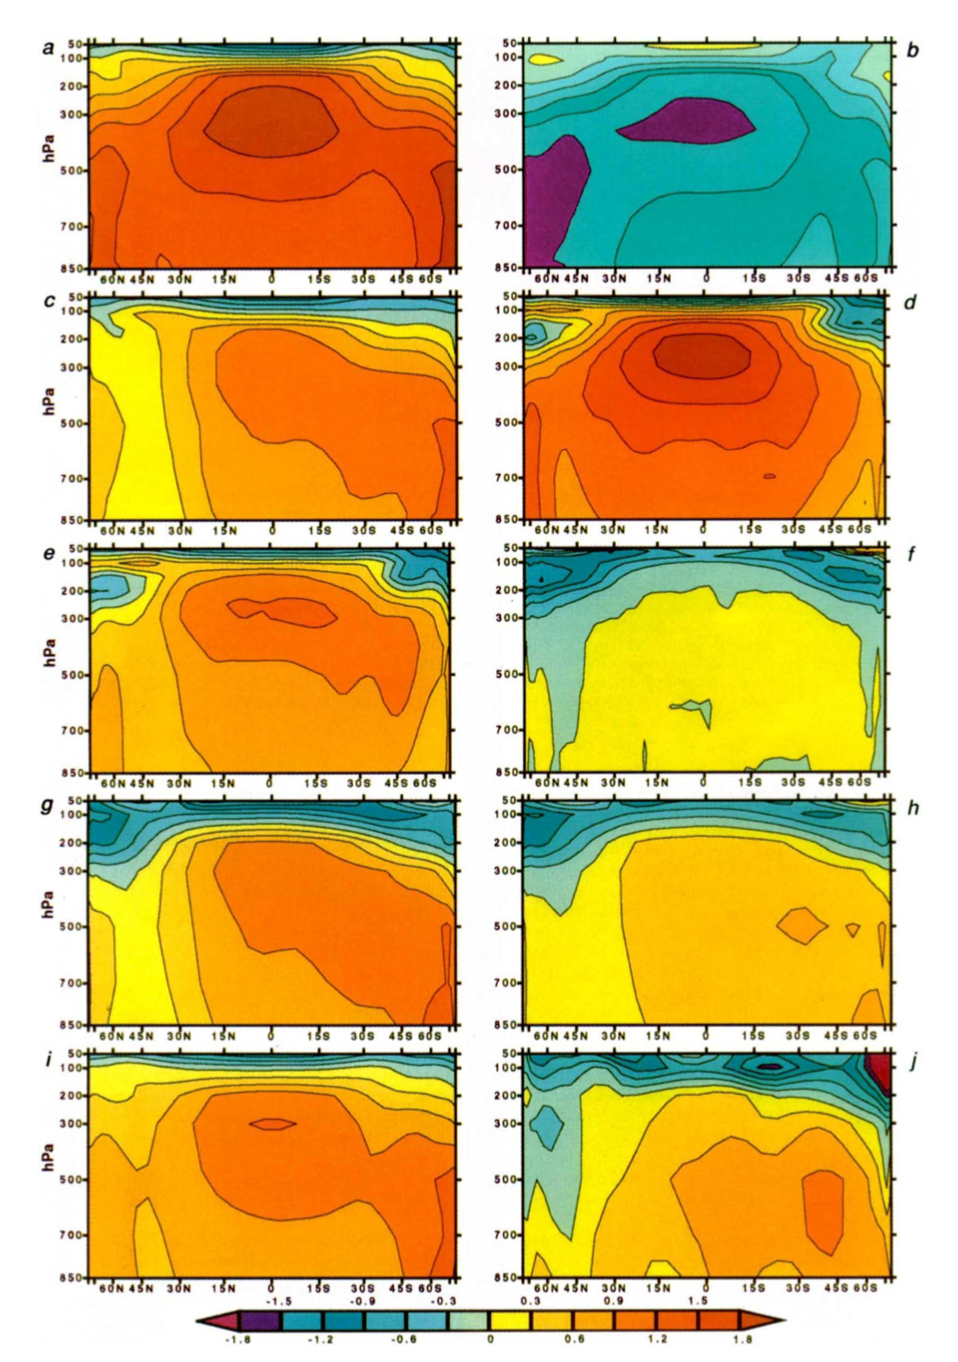
1975 - Manabe and Wetherald#
Another seminal paper for climate modeling: The Effects of Doubling the CO2 Concentration on the climate of a General Circulation Model
For the first time the effects of doubling atmospheric CO2 levels.
polar amplification
climate sensitivity of 2.9C
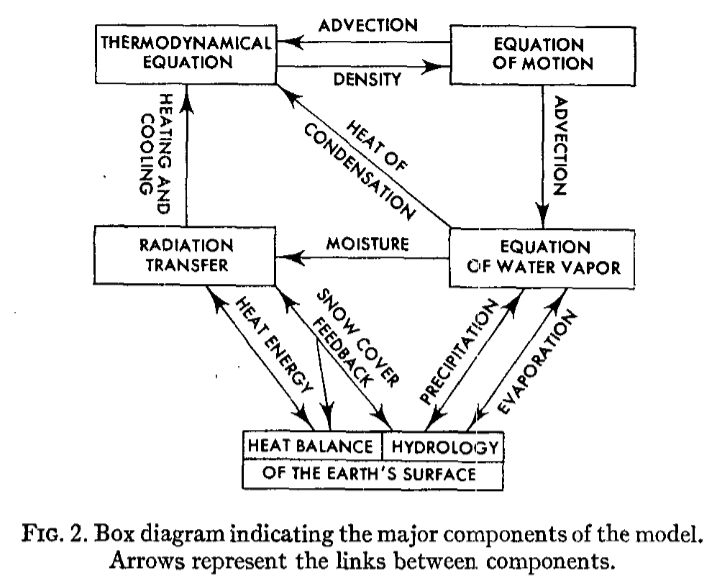
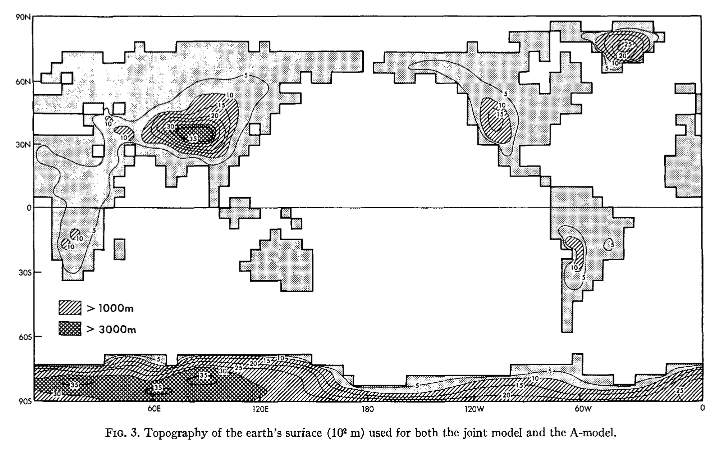
1975 - Manabe, Bryan, Spelman#
the first coupled atmosphere-ocean GCM (AOGCM)
A Global Ocean-Atmosphere Climate Model. Part I. The Atmospheric Circulation
1975 - National Academy of Sciences#
the US Committee for the Global Atmospheric Research Program (GARP)
1975 - Wally Broecker#
first coined the term “global warming”.
Climatic Change: Are We on the Brink of a Pronounced Global Warming?
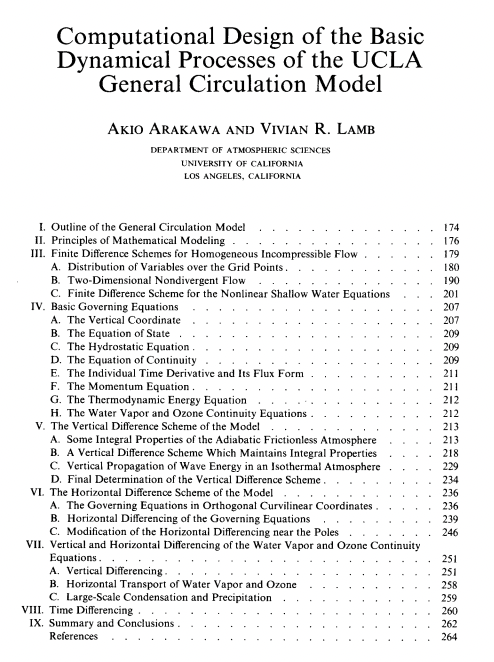
1977 - Arakawa and Lamb#
Computational Design of the Basic Dynamical Processes of the UCLA General Circulation Model
Methods in Computational Physics: Advances in Research and Applications
1979 - The Charney Report#
A retired representative from the Mobil oil company.
heat from the atmosphere could be temporarily absorbed by the oceans
climate sensitivity of 2-4.5C
1979 - Newell and Dopplick#
1980 - World Climate Research Programme (WCRP)#
to determine the predictability of climate and to determine the effect of human activities on climate

1985 - Department of Energy#
Projecting the climatic effects of increasing carbon dioxide
Carbon dioxide-climate controversy
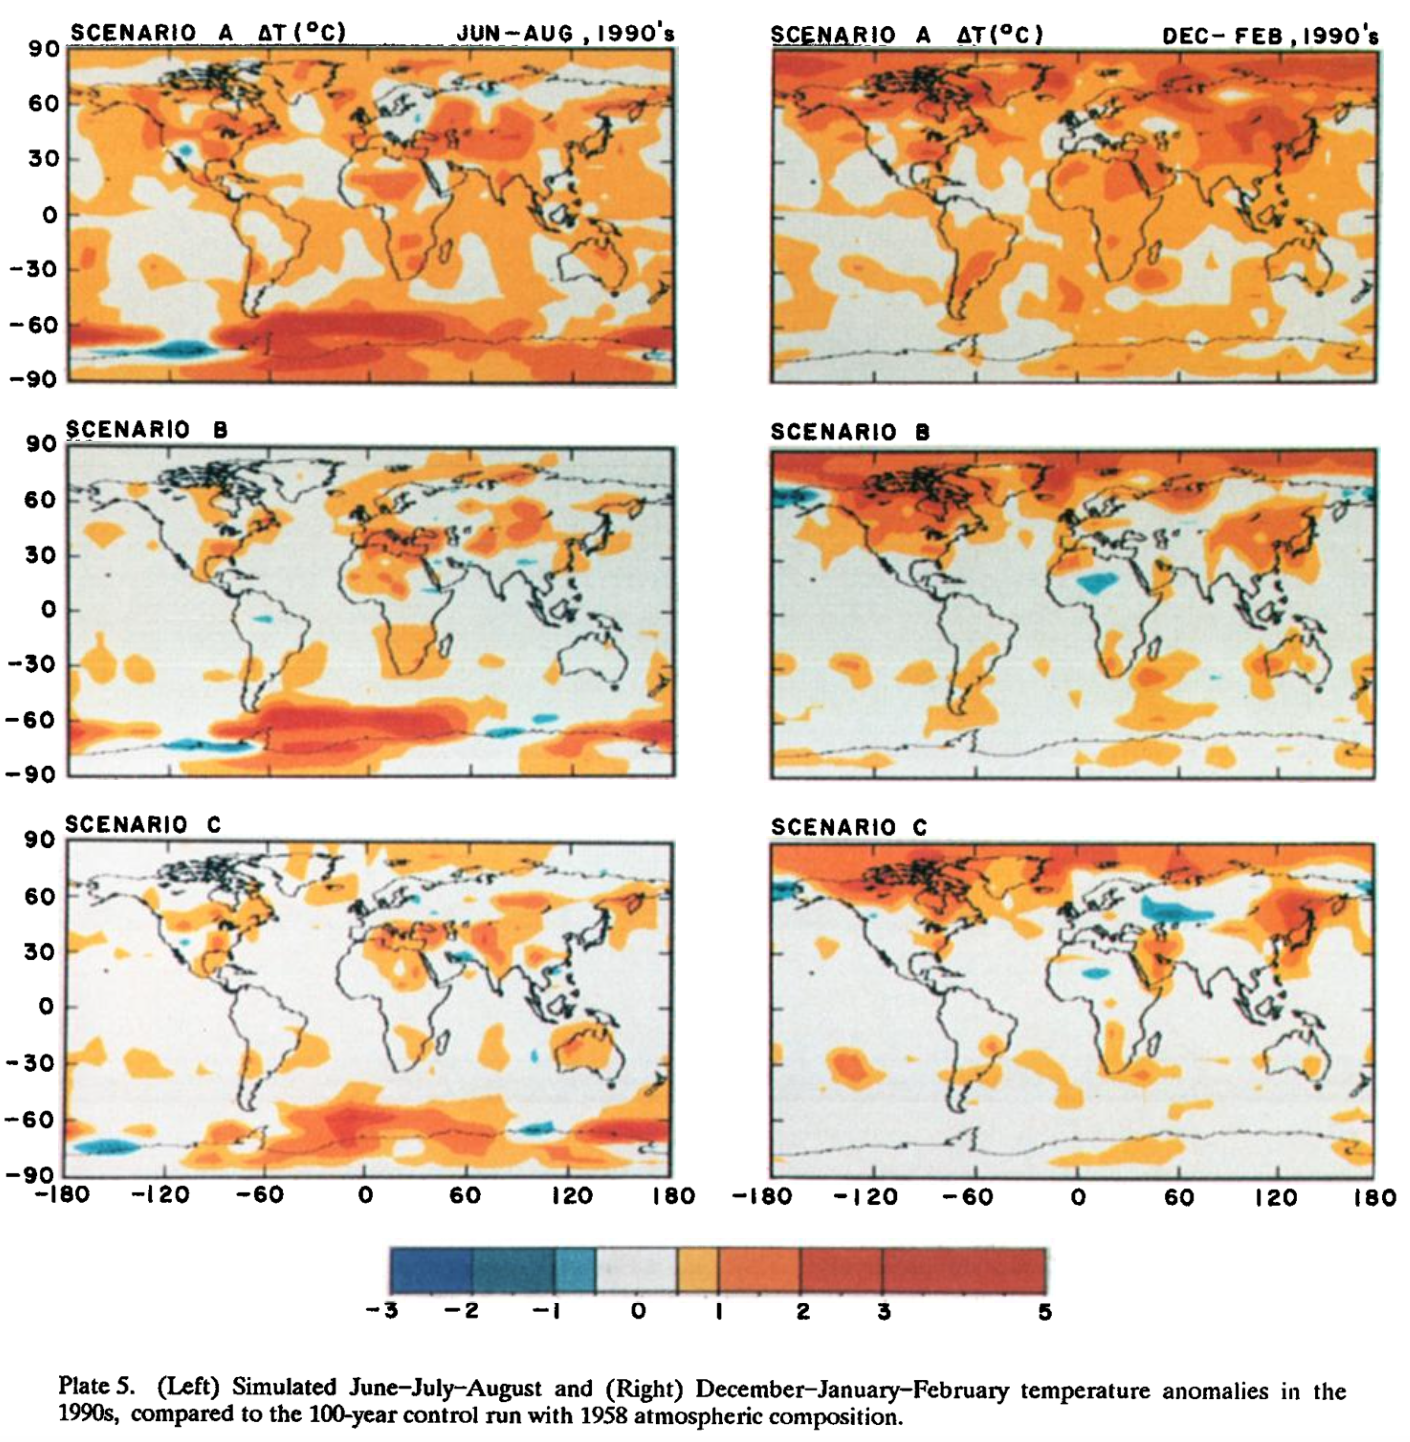
1988 - Hansen’s three scenarios#
Global climate changes as forecast by Goddard Institute for Space Studies three-dimensional model
US Senate hearing
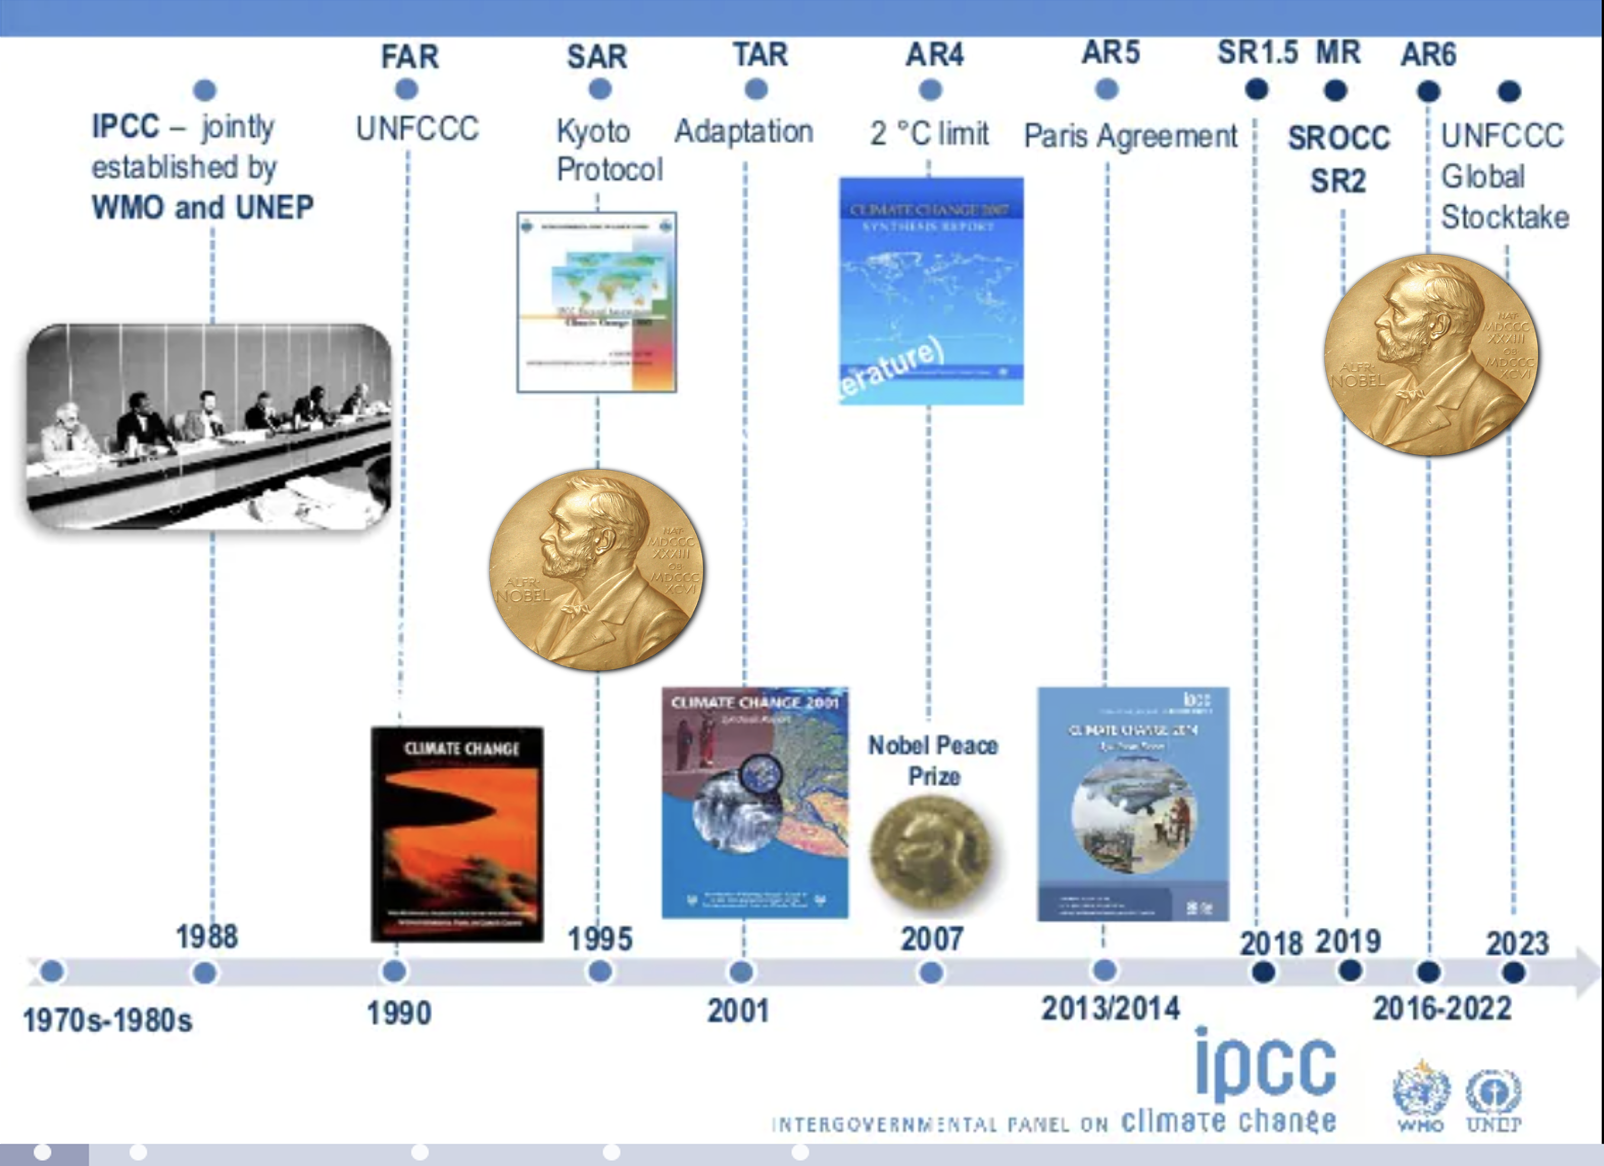
1988 - IPCC#
The United Nations Environment Programme (UNEP) and the World Meteorological Organization (WMO) establish the Intergovernmental Panel on Climate Change (IPCC).
“provide the world with a clear scientific view on the current state of knowledge in climate change and its potential environmental and socio-economic impacts”
First IPCC chair is Bert Bolin.
website: here
1989 - AMIP#
1989 - New NCAR and GFDL AOGCMs#
NCAR AOGCM: Washington and Meehl (1989)
GFDL AOGCM: Stouffer et al. (1989)
1990 - Met Office Hadley Centre#
Margaret Thatcher, the UK prime minister, formally opens the Met Office’s Hadley Centre for Climate Prediction and Research in Bracknell, Berkshire.
The first Hadley Centre coupled model boasts “11 atmospheric levels, 17 ocean levels and 2.5° × 3.75° resolution”.
1990 - First IPCC report#
August 27, 1990 — August 30, 1990.
Report: here
about 0.3C warming per decade
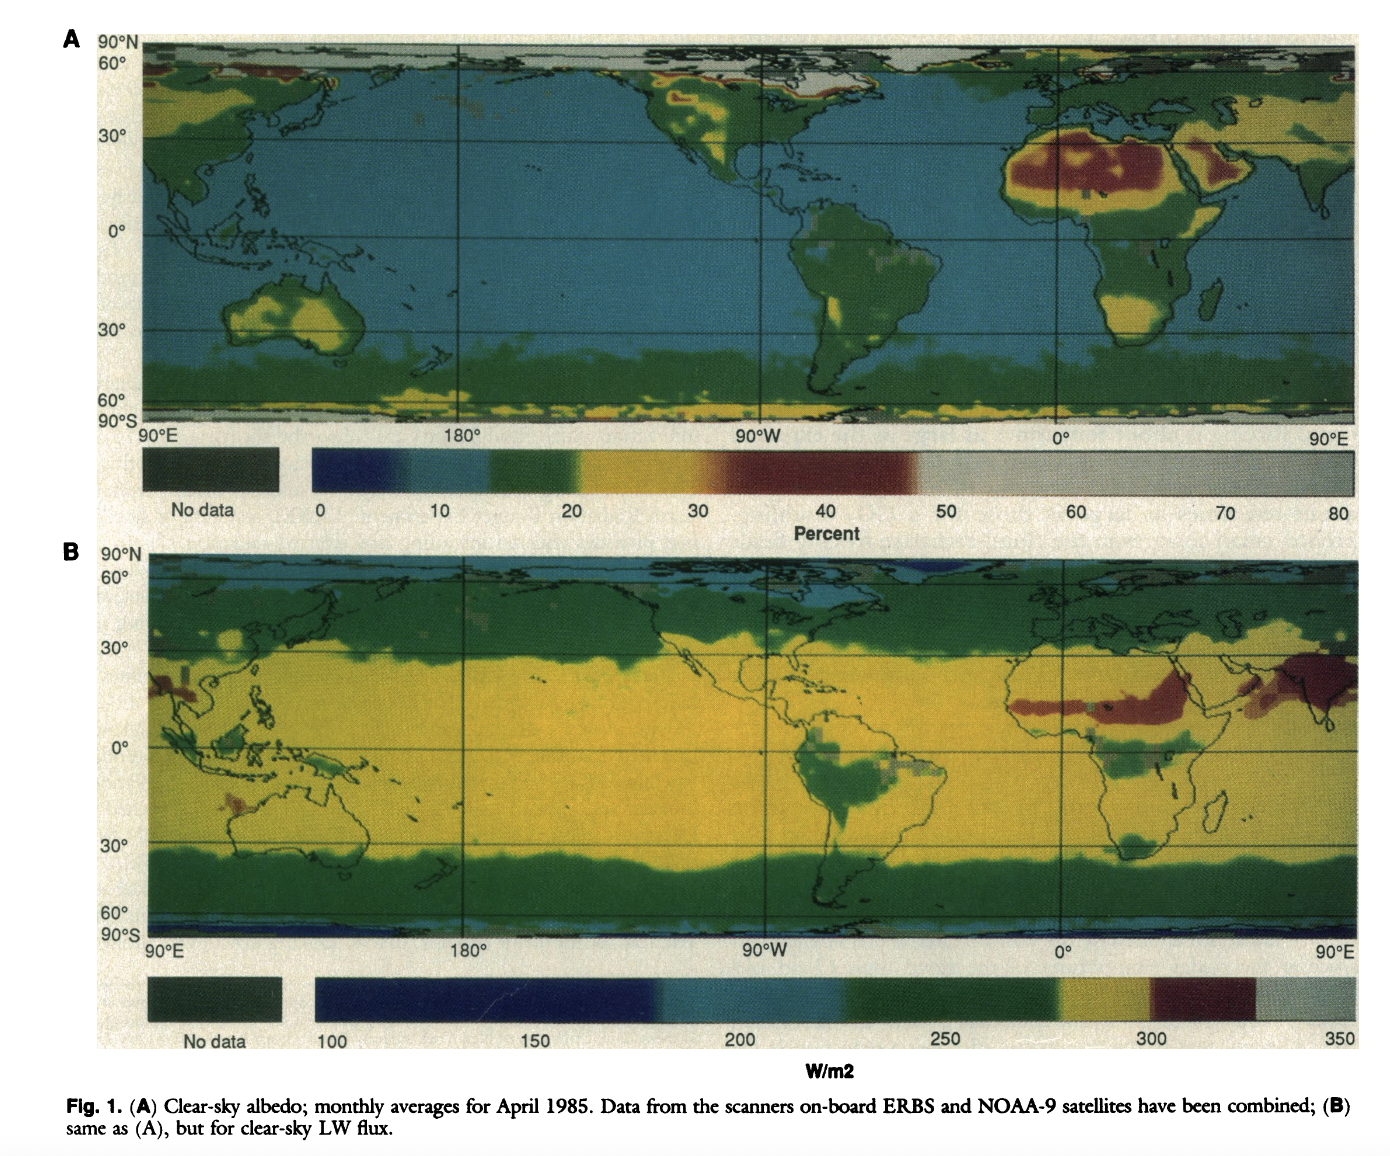
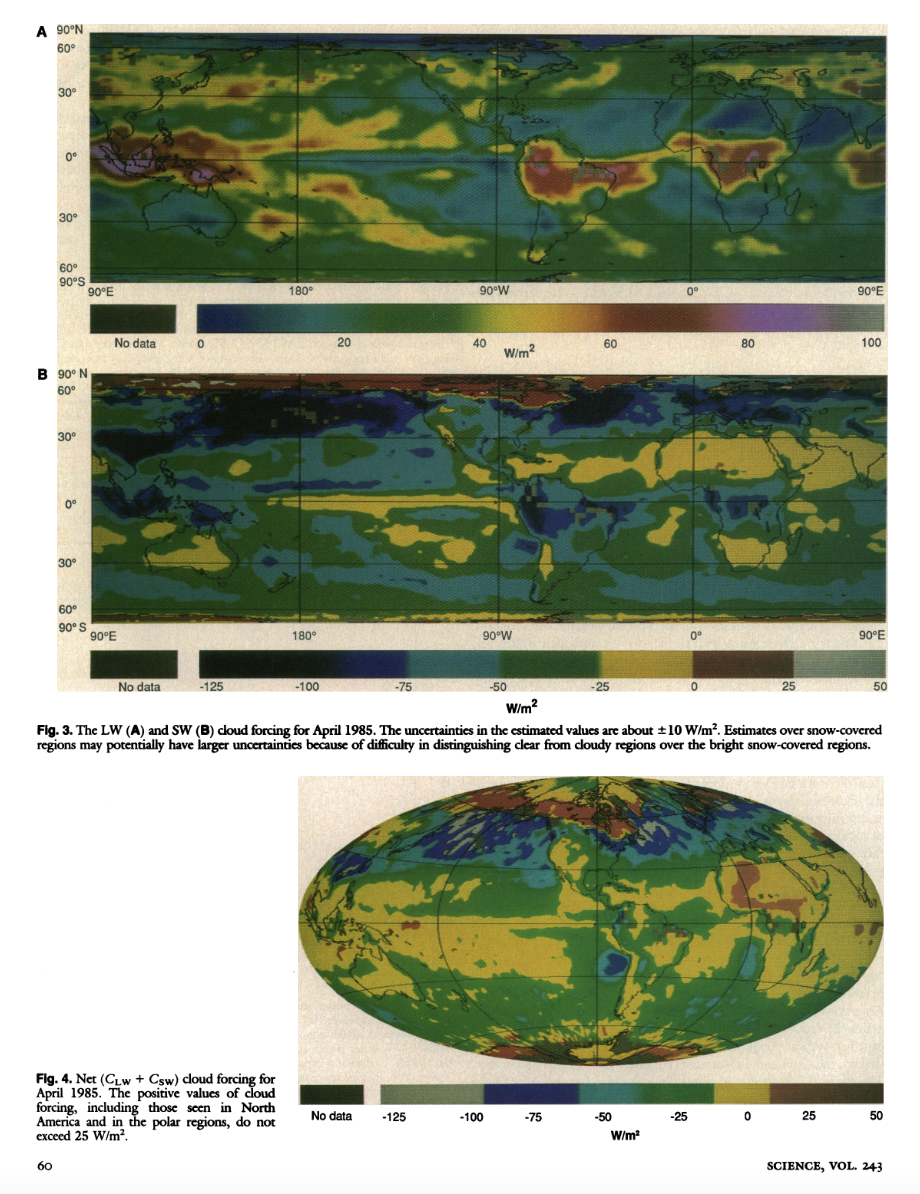
1990 - Robert D. Cess#
uncertantiy from cloud is large.
Cloud-Radiative Forcing and Climate: Resultsfrom te Earth Radiation Budget Experiment
1991 - Eruption of Mount Pinatubo#
1992 - Kevin Trenberth#
1995 - CMIP launched#
The Coupled Model Intercomparison Project (CMIP)
18 models from 14 modelling groups are included
official website: here
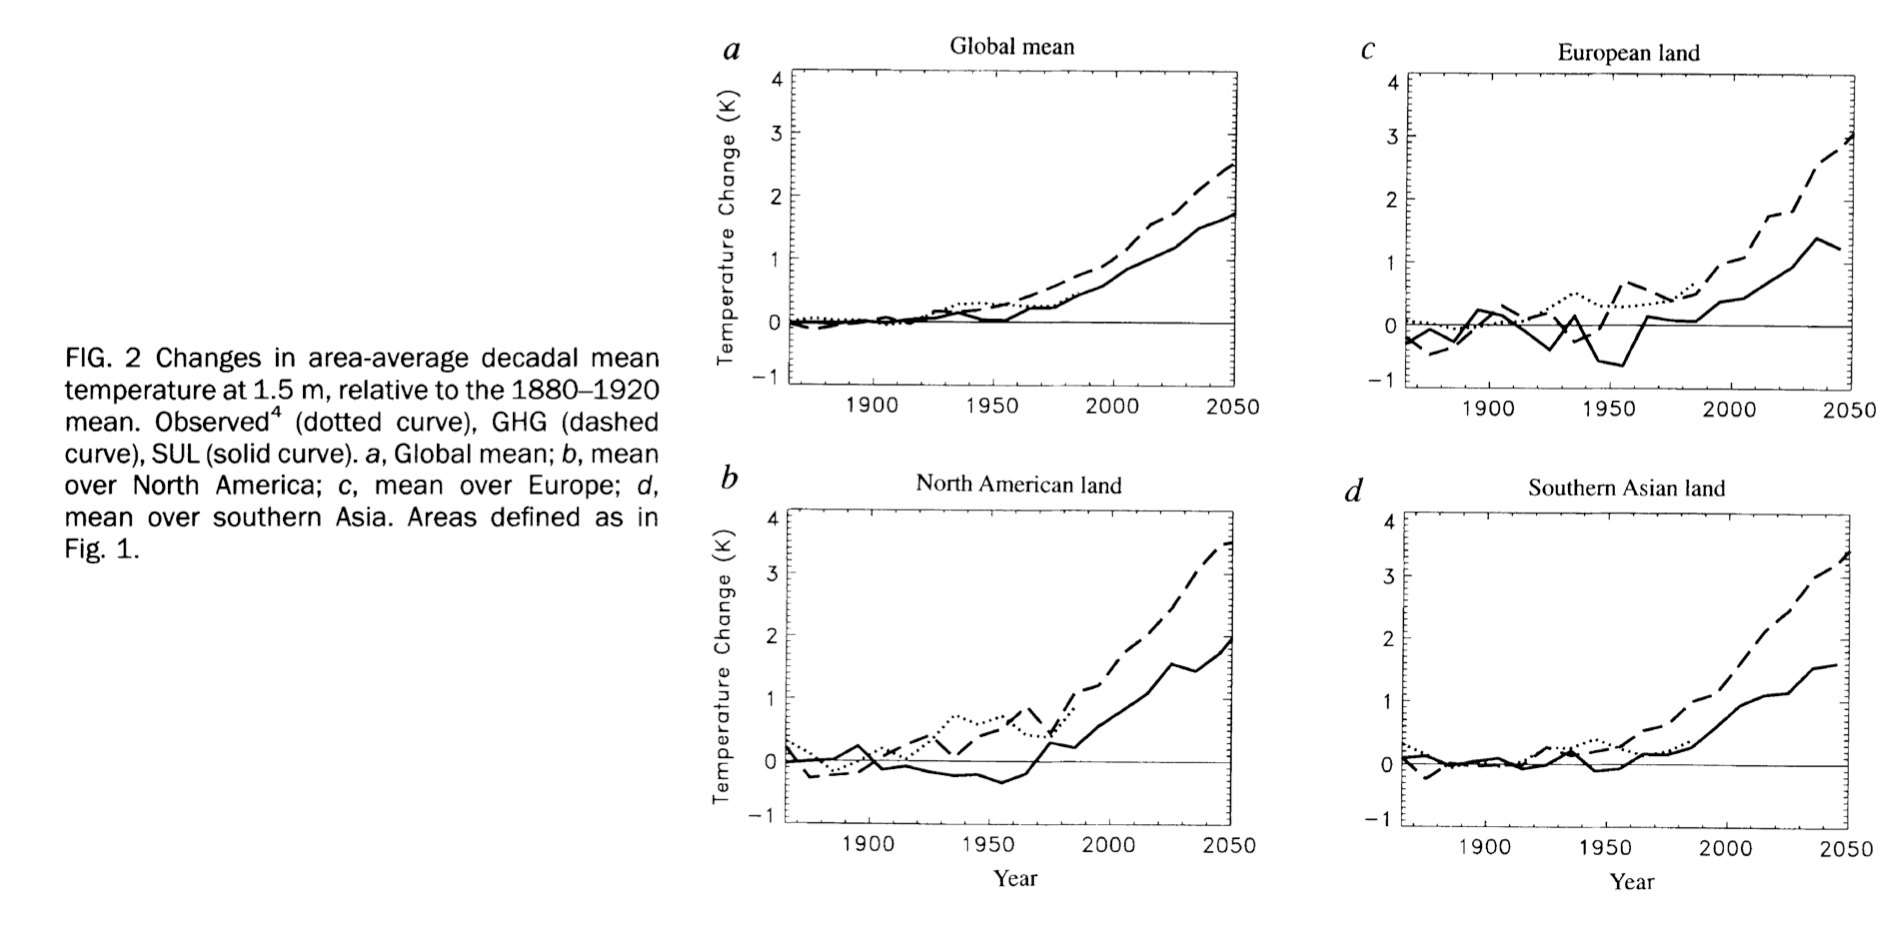
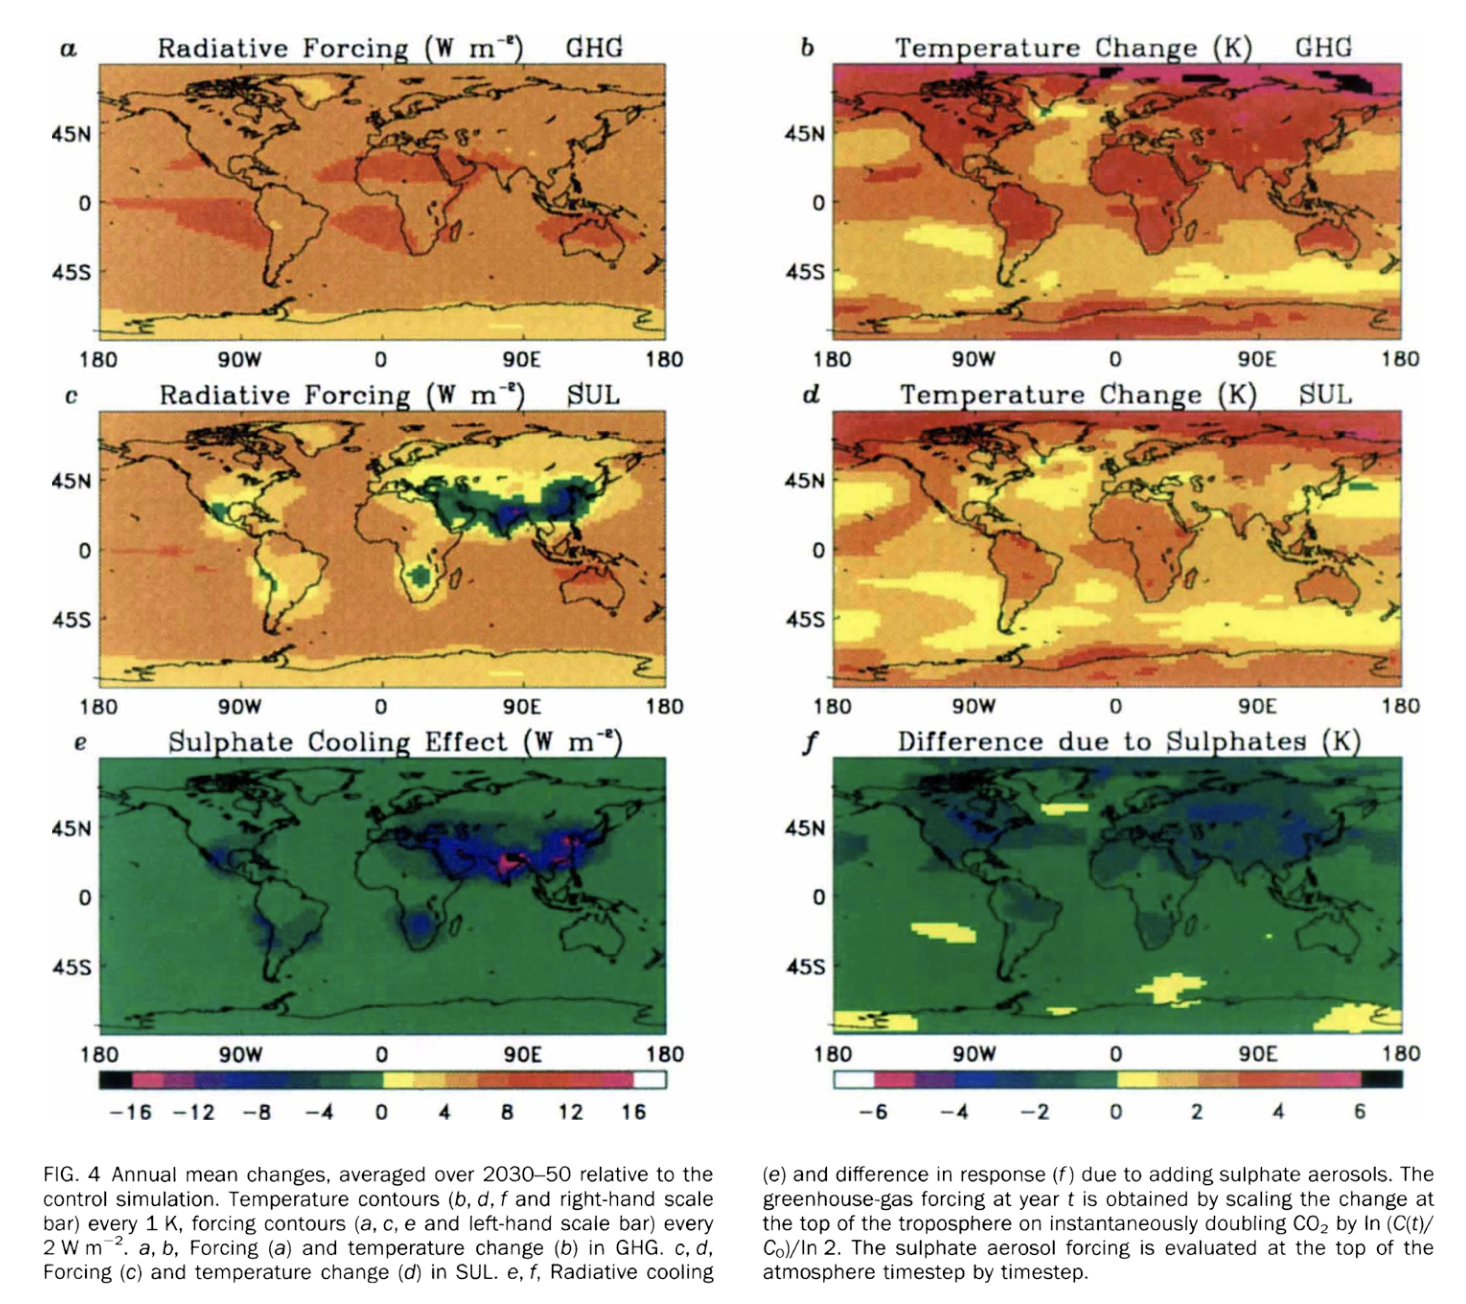
1995 - John Mitchell#
Climate response to increasing levels of greenhouse gases and sulphate aerosols
based on Rasool and Schneiderr (1971): Atmospheric Carbon Dioxide and Aerosols: Effects of Large Increases on Global Climate
1995 - Draft of IPCC’s second assessment report#
Human activity is a likely cause of the warming of the global atmosphere
Dr Richard S Lindzen from MIT, however, was unconvinced: the model estimate of natural variability being correct?
1995 - US Congressional Hearing#
“climate models and projections of potential impacts of global climate change”.
chared by Dana Rohrabacher
He asks: “Are we so certain about the future climate changes that we should take action that will change the lives of millions of our own citizens at a cost of untold billions of dollars?”
1996 - Ben Santer’s fingerprint study#
A search for human influences on the thermal structure of the atmosphere
attached by climate sceptics: here
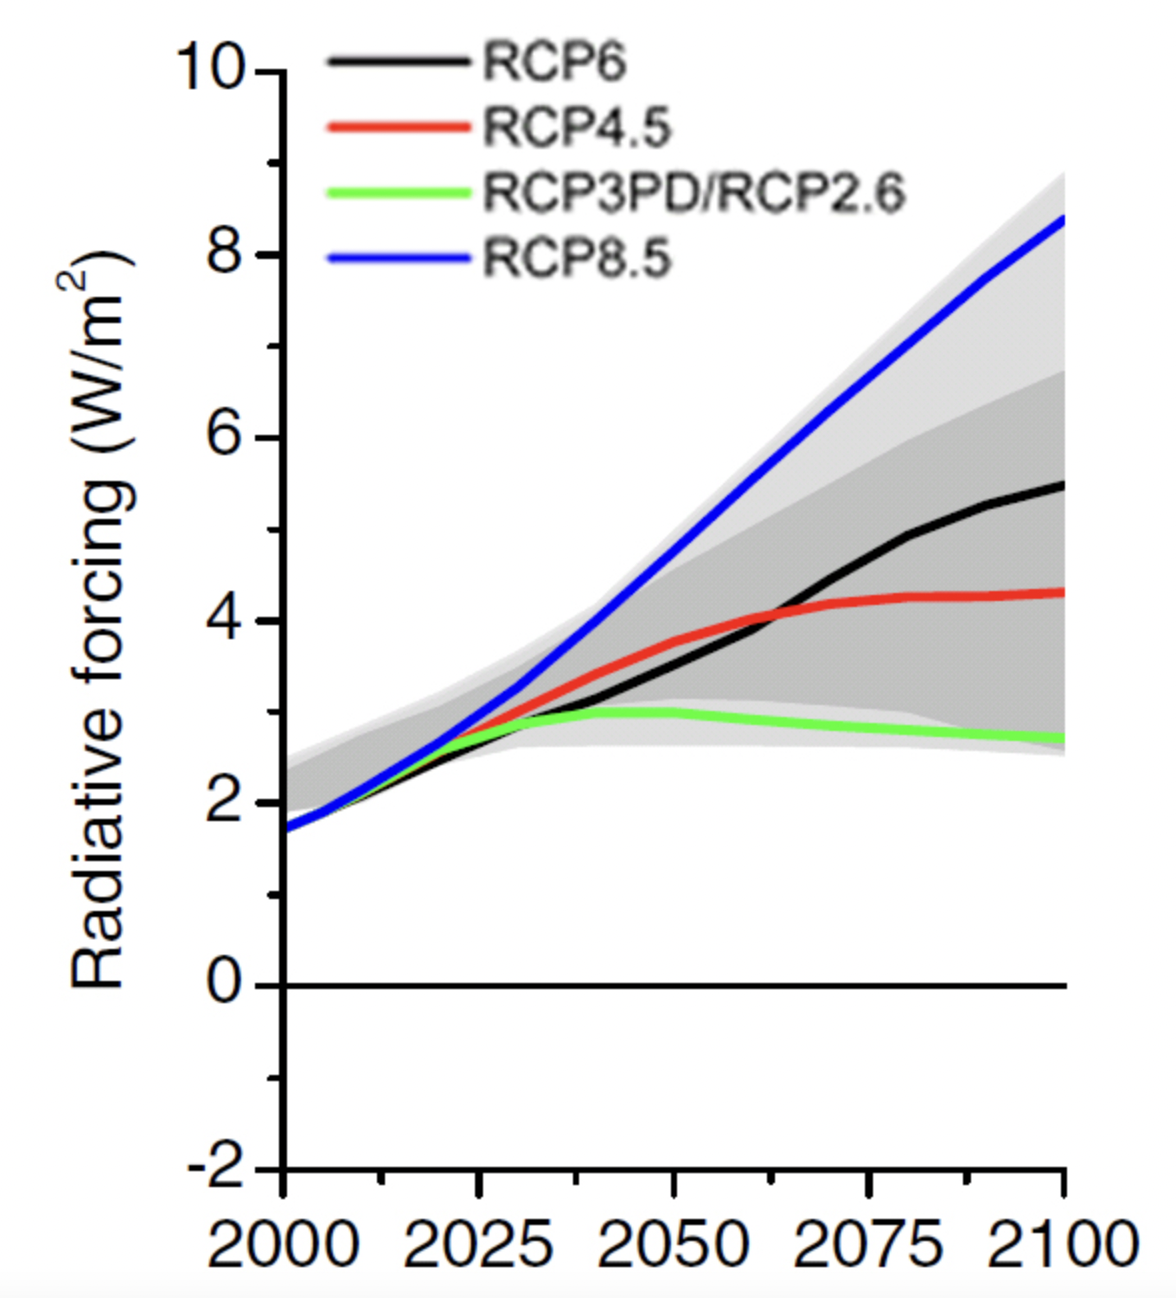
2000 - IPCC’s Special Report on Emissions Scenarios#
The IPCC team is led by Professor Nebojsa Nakicenovic
Representative Concentration Pathways (RCPs) in time for the IPCC’s fifth assessment report in 2014.
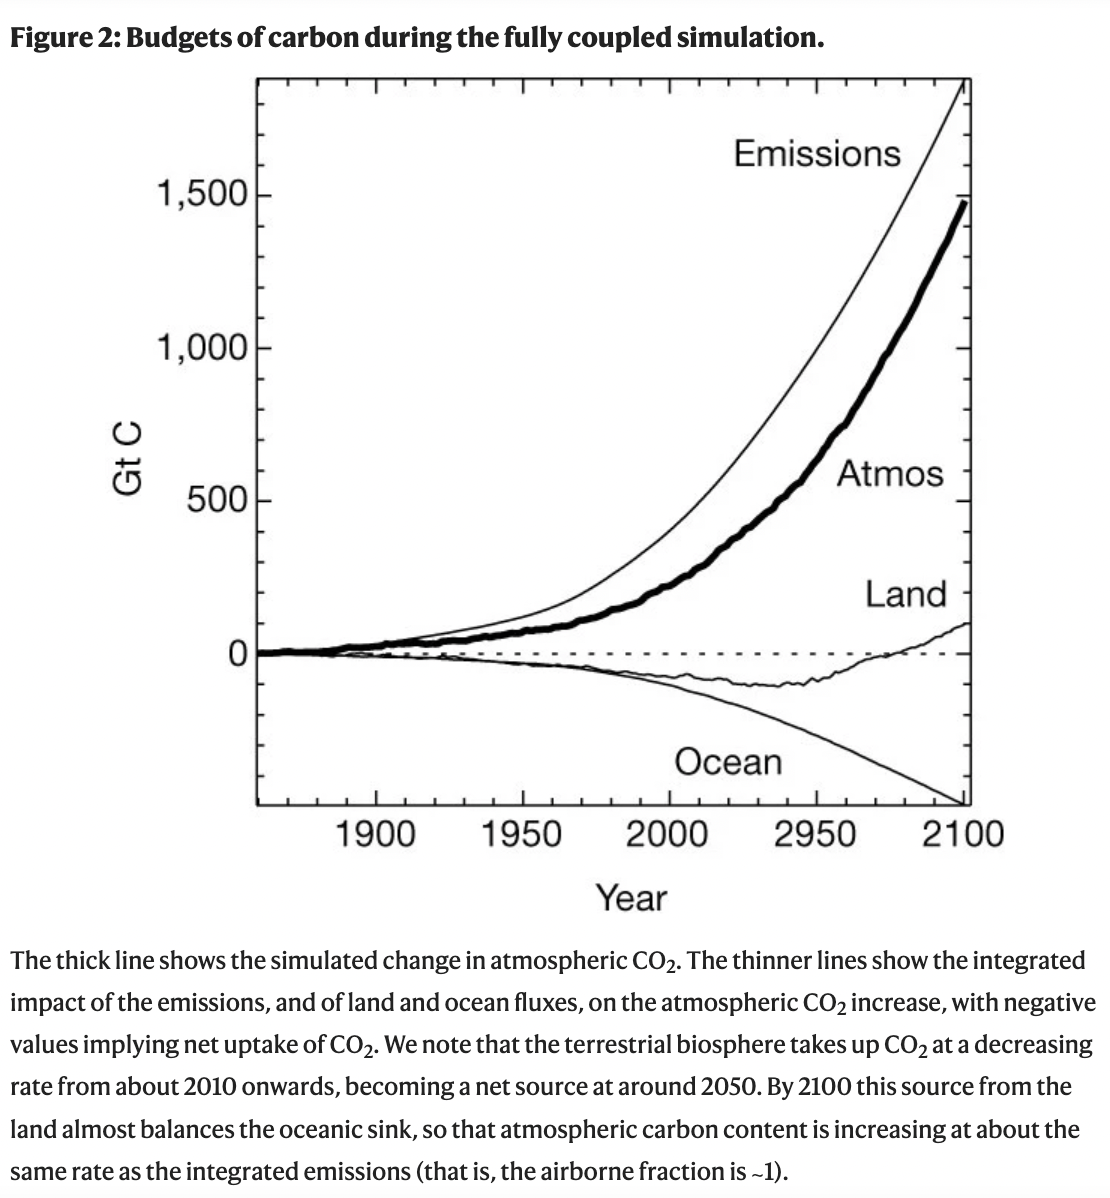
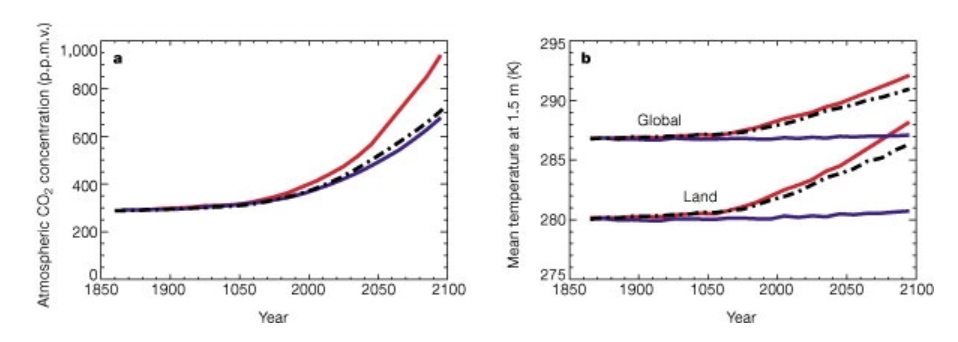
2000 - Peter Cox#
The first “fully coupled three-dimensional carbon-climate model”.
Acceleration of global warming due to carbon-cycle feedbacks in a coupled climate model
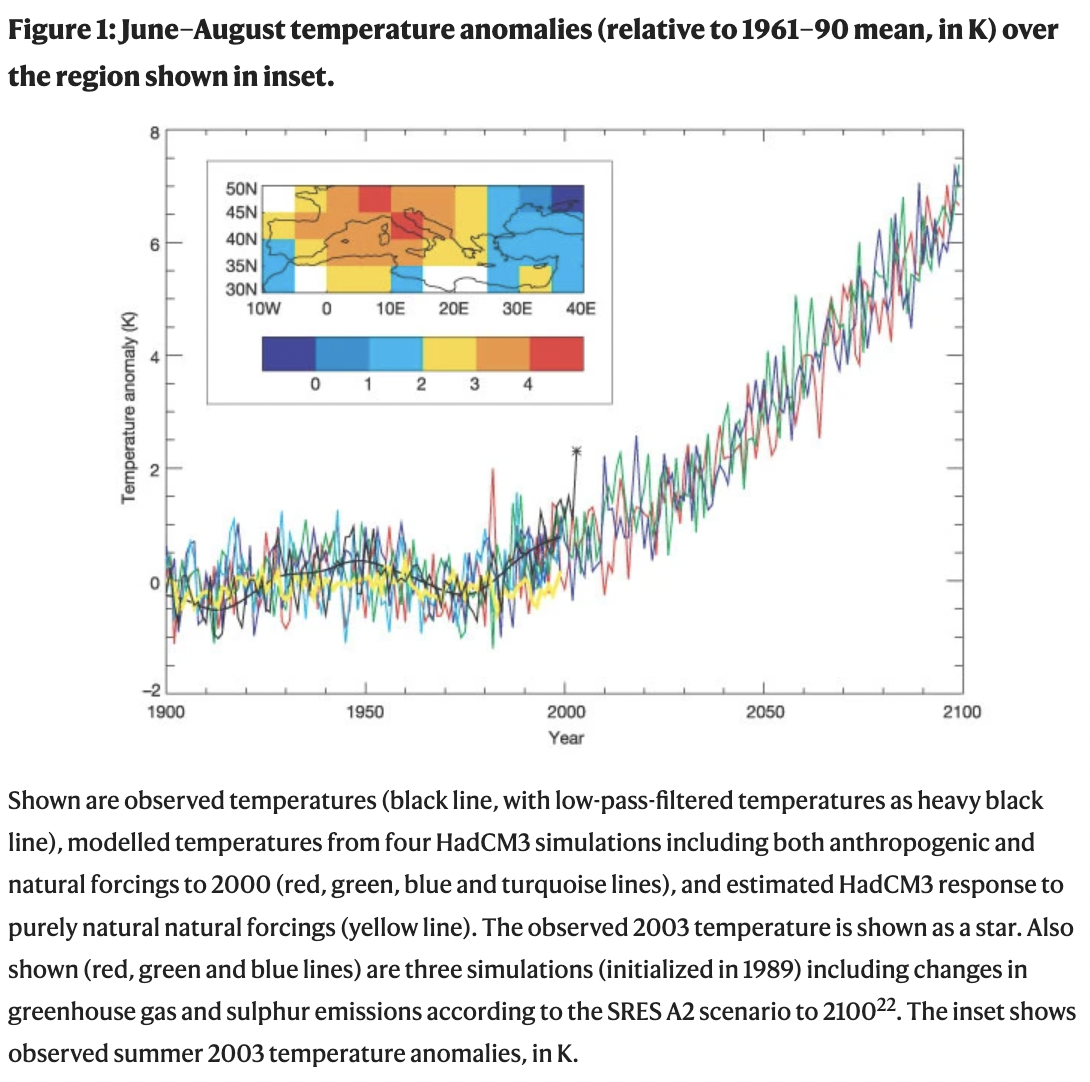
2004 - Peter Stott and Myles Allen#
It was very likely that human influence at least doubled the chances of heatwave occurring
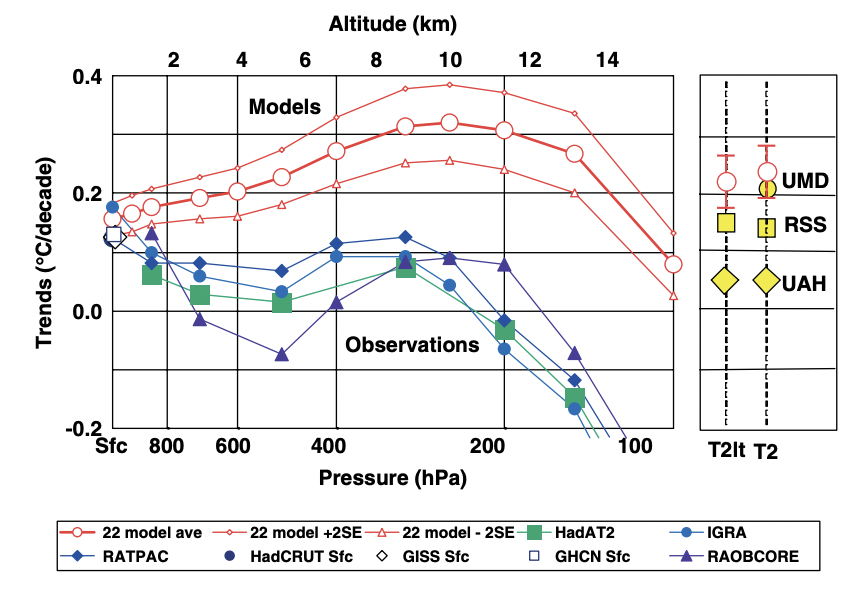
2007 - Santer vs Douglass#
Climategate affair in 2009.
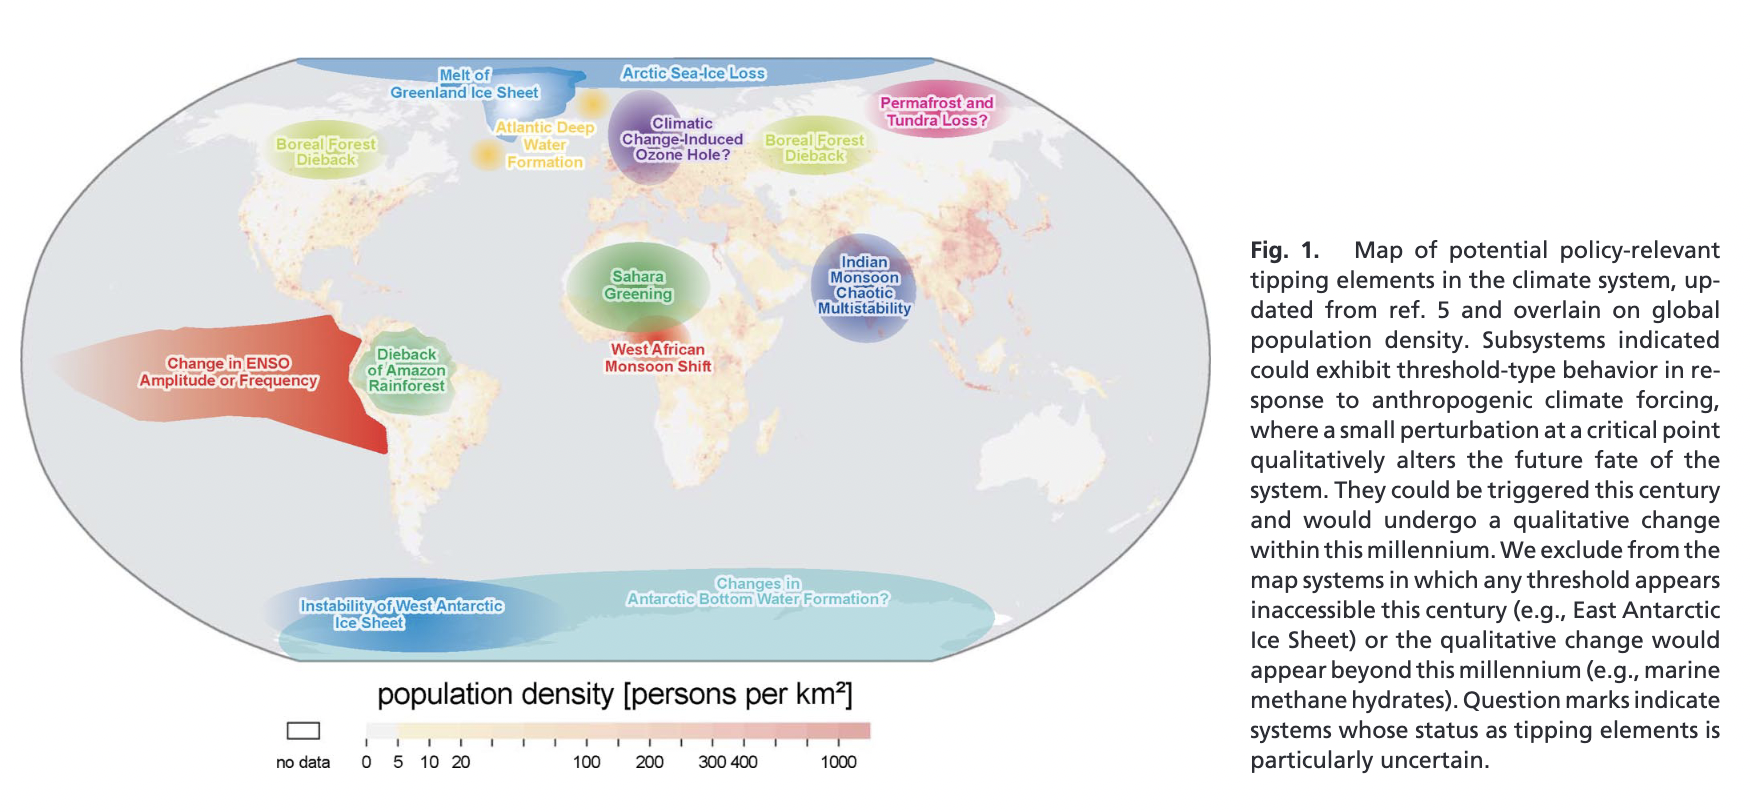
2008 - Tim Lenton#
2008 - Veerabhadran Ramanathan and Greg Carmichael#
2008 - CMIP5#
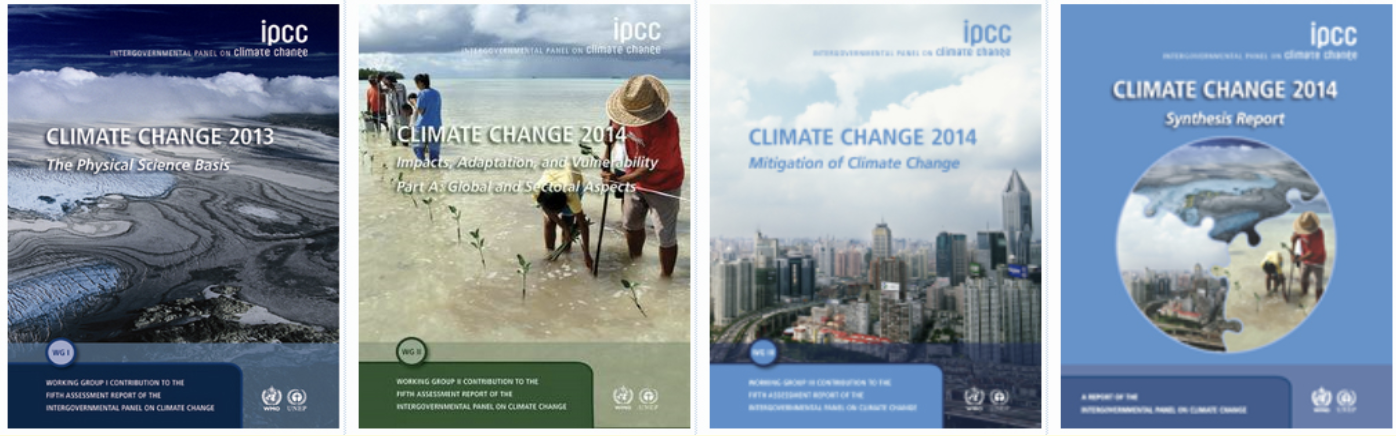
2013 - IPCC’s fifth assessment report#
2017 - Medhaug et al.#
2021 - IPCC’s sixth assessment report#

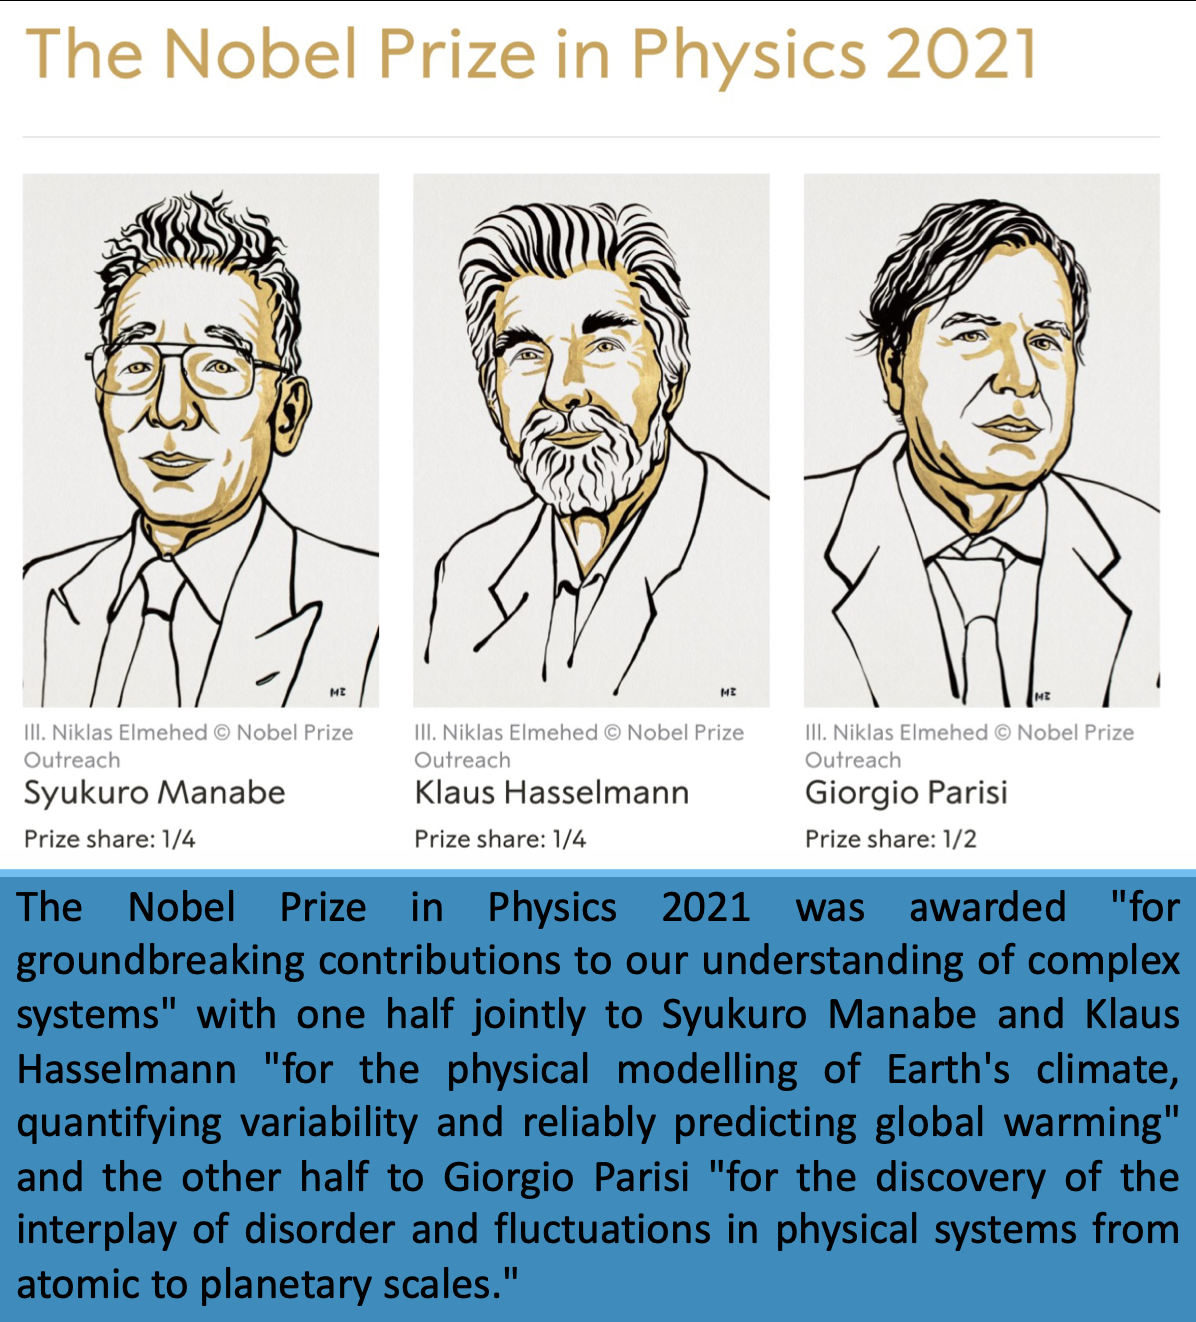
2021 - The Nobel Prize in Physics#
Syukuro Manabe
Klaus Hasslmann
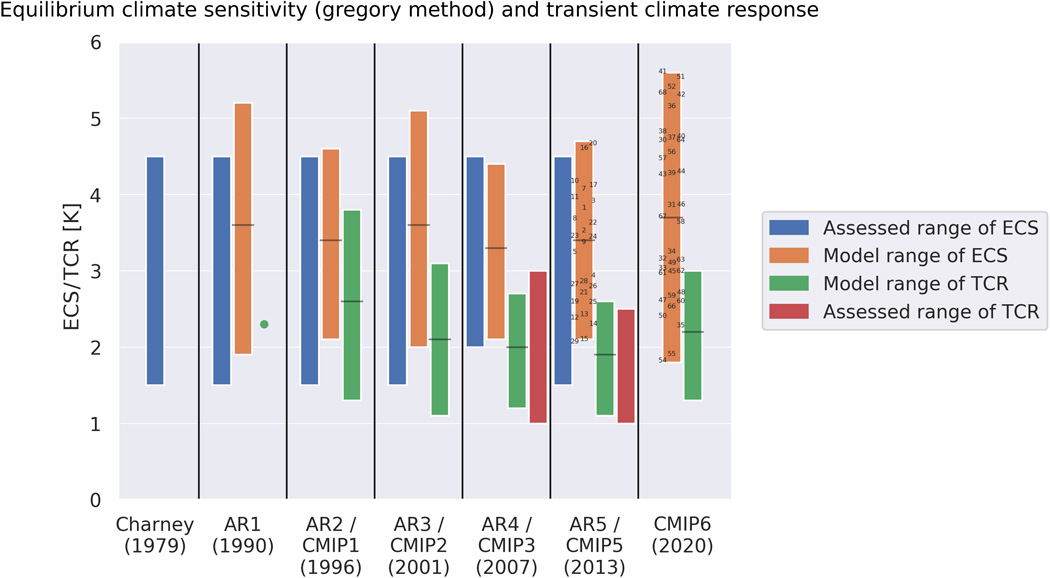
Doing this, doing that…How is the performance of climate models?#
The equilibrium climate sensitivity (ECS) and transient climate response (TCR) are still showing wide ranges paper here:
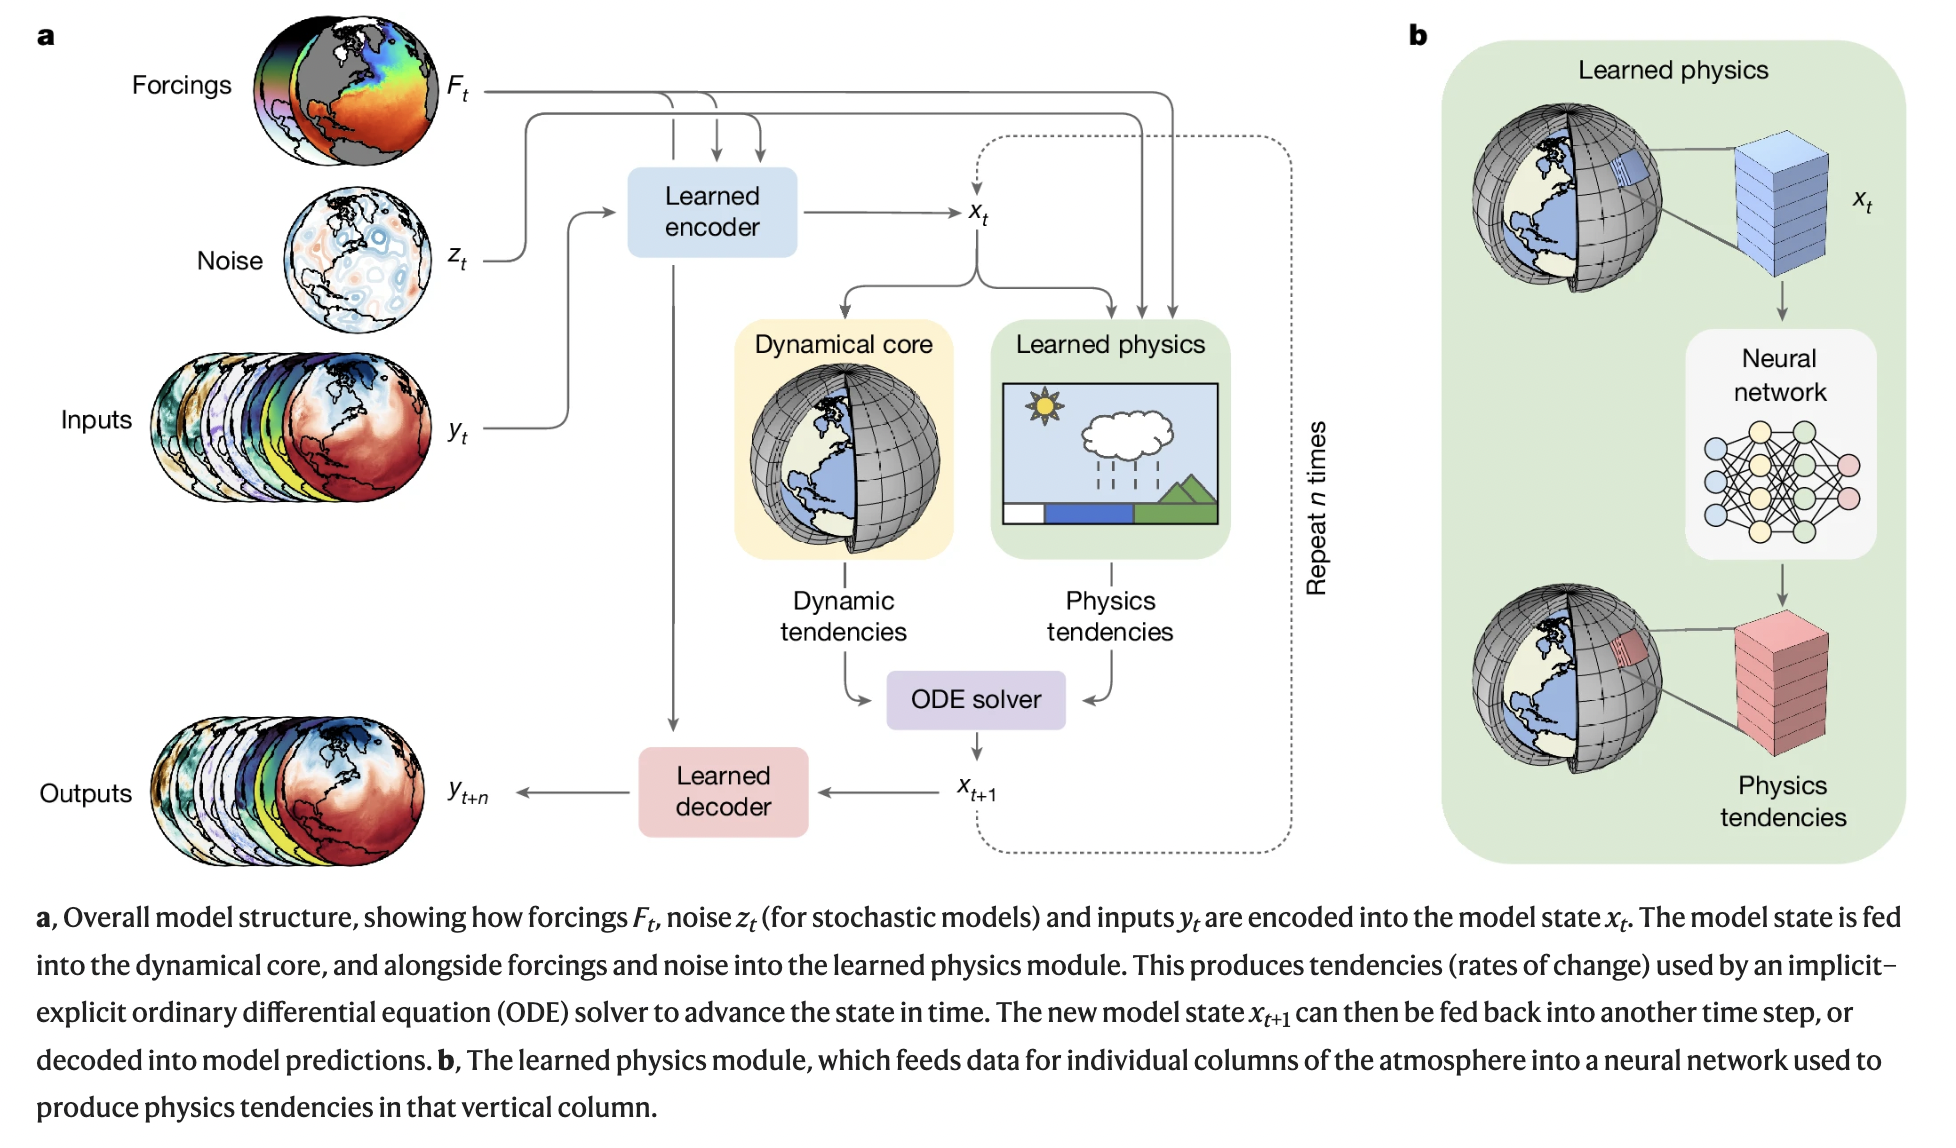
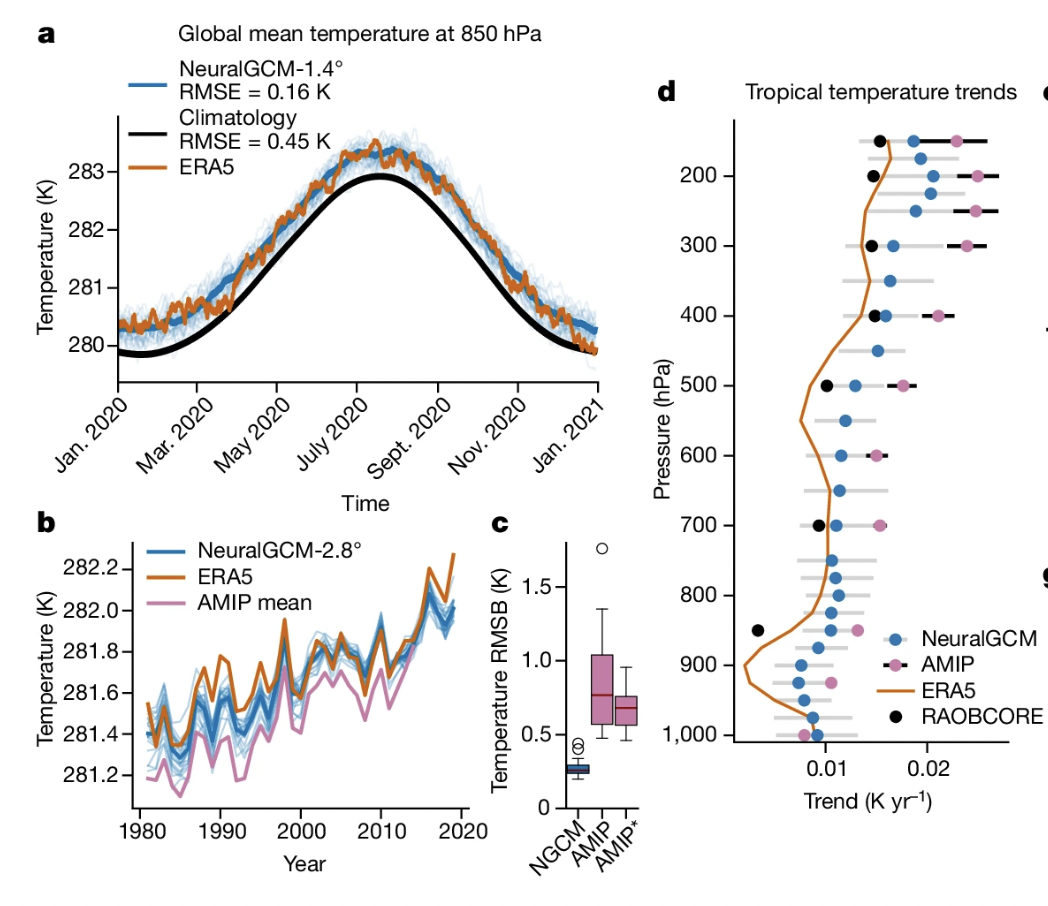
2024 - Google’s NeuralGCM#
Future from now?#
high-resolution climate modeling?
AI approach?
A recent prespective paper, Bordoni et al. (2025), may help answer this question:
“We argue that the past is prologue for climate modeling and that embracing a variety of tools and methodologies is key to achieving convergent paths for meaningful progress.”
“Projects such as the Coupled Model Intercomparison Project (CMIP) have allowed the global community to work together to address the question of what we should expect in terms of future climate change and to understand how our models behave.”
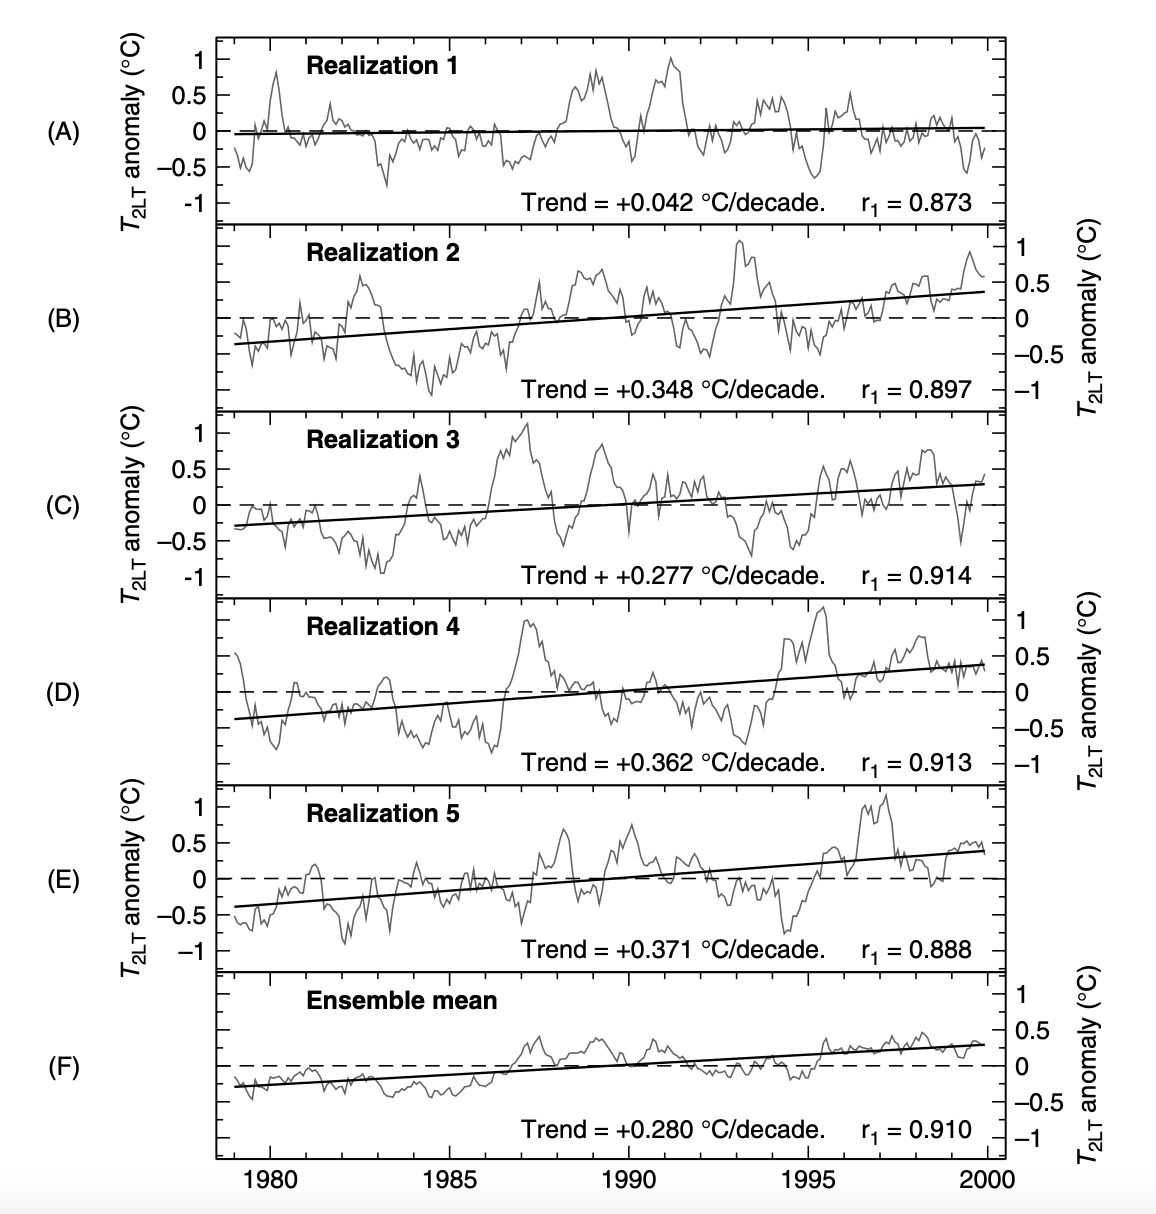
“the use of simulations starting from different initial conditions but produced with a single climate model and identical external forcing has highlighted the importance of natural variability as a source of uncertainty in regional climate predictions across a range of timescales.”
“Climate modeling has traditionally relied on improving predictions through advancements in theoretical understanding and the representation of physical processes.”
“This longer record combined with the growing climate change signal means that signals are starting to emerge from the noise across many regions and seasons.”
“At the same time, new tools are becoming available such as km- scale models and AI/ML methods. Therefore, while the climate is now changing rapidly, so too is the field of climate science, leading many to question where the field should be moving next.”
“As one increases resolution, adds complexity, or includes new parameterizations, we uncover new physics but also new issues.”
“The reality is that there will likely be steps back before large steps forward are possible and it is important for prediction and understanding to advance together.”
“Weather emulators can be run by graduate students on their laptops in contrast to the most sophisticated physics-based high resolution NWP models that involve many scientists at large weather centers and require state-of-the-art super- computers.”
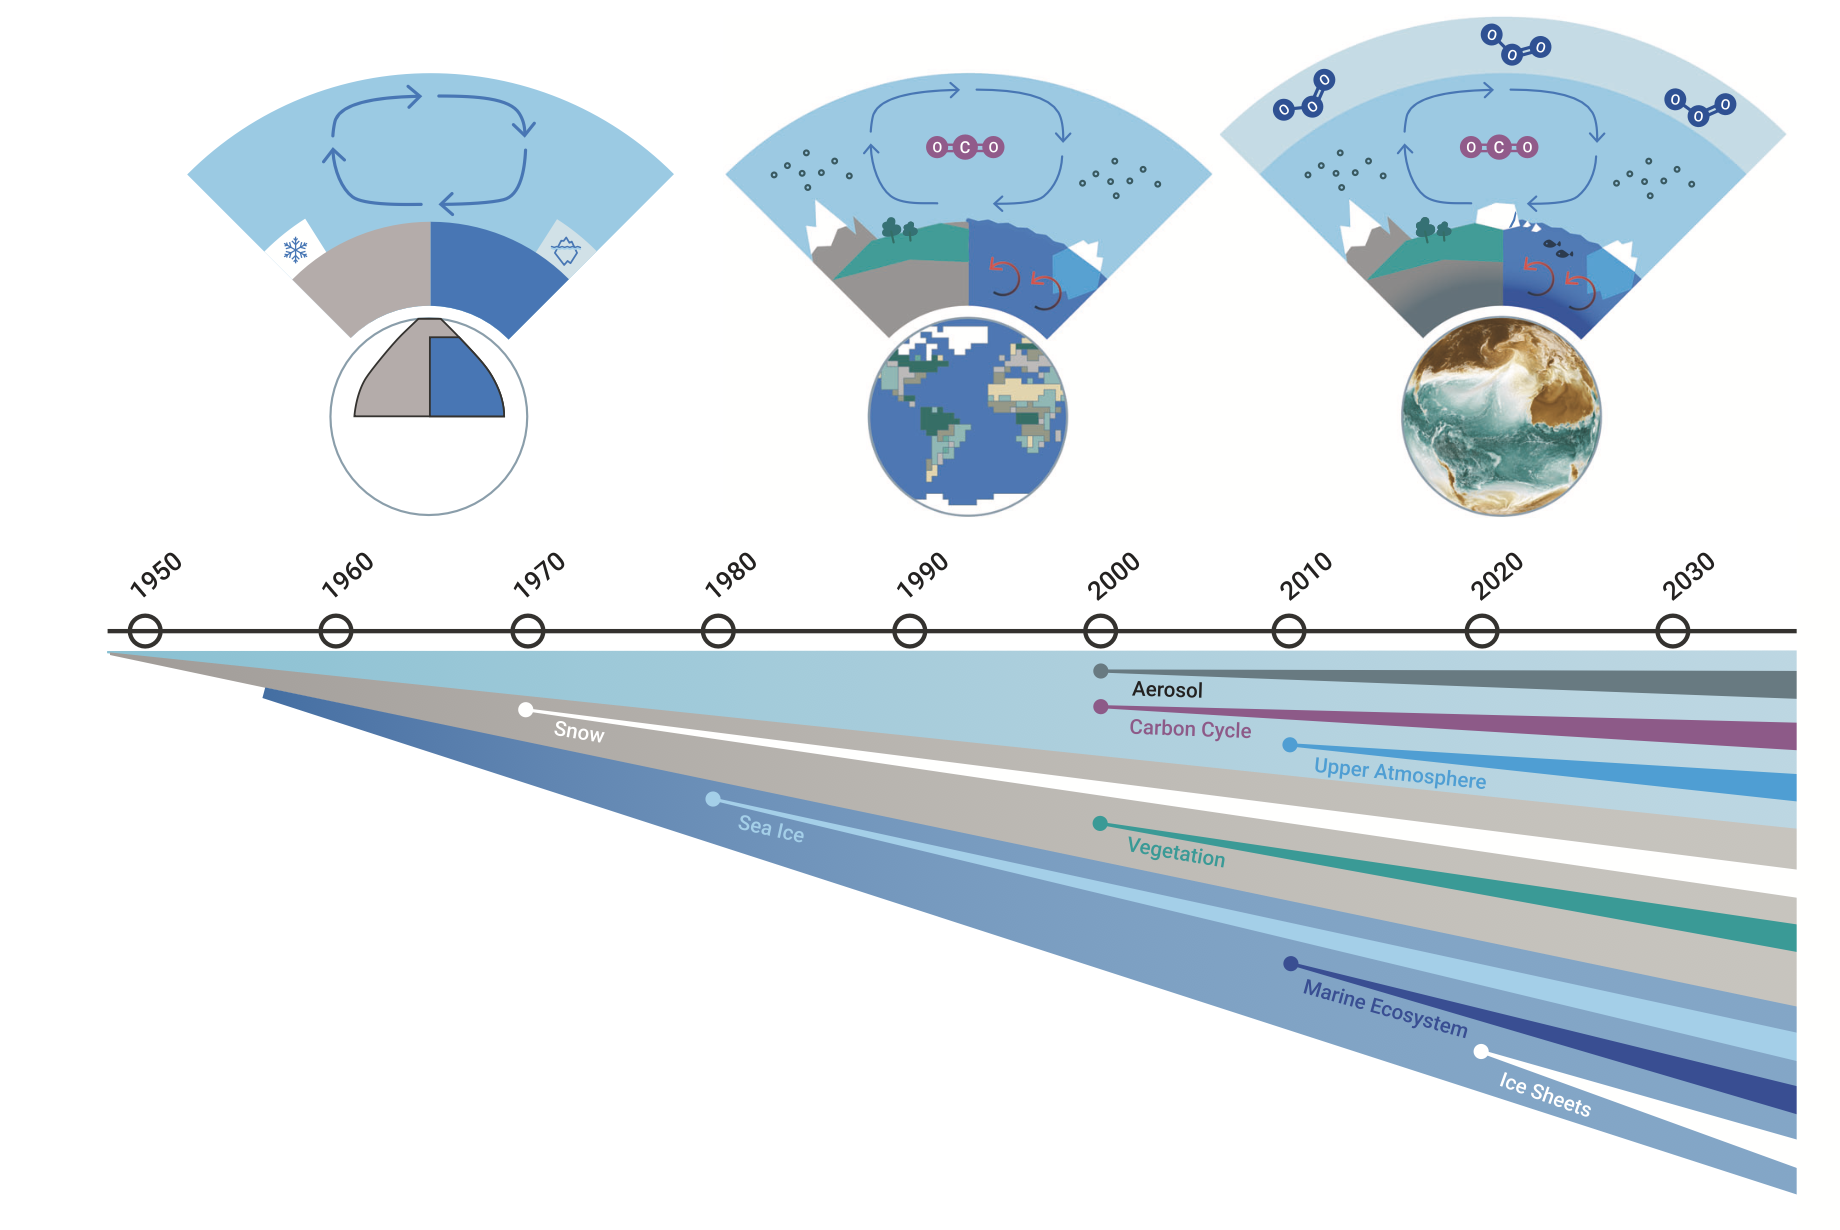
Fig. 69 Progression of model components from early climate models to the latest Earth System Models. Source: Bordoni et al. (2025)#
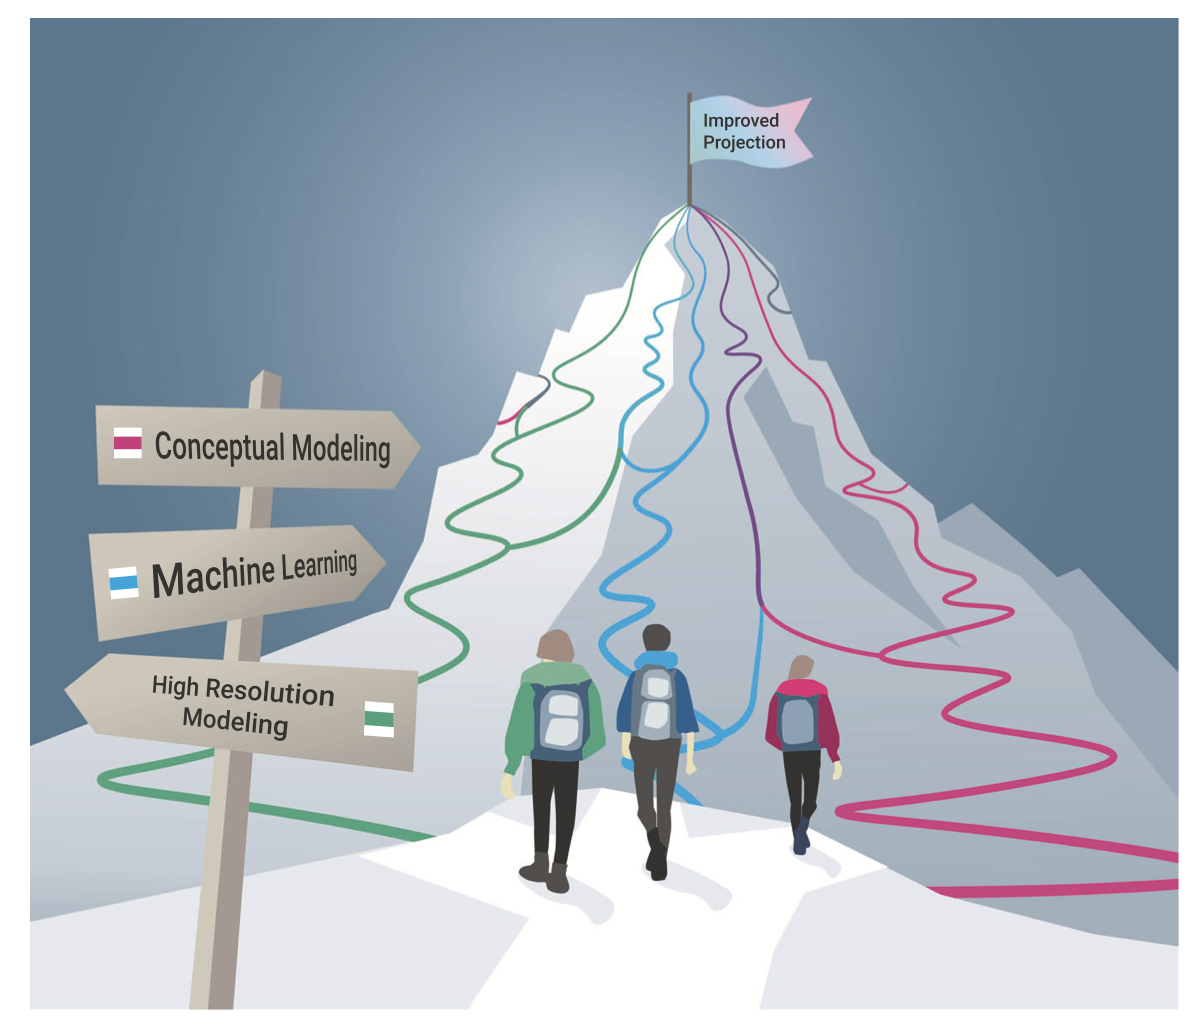
Fig. 70 Schematic of convergent paths toward advances in climate modeling. Embracing different approaches, including hierarchical modeling, machine learning, and high-resolution modeling, will utimately lead to improved climate projections. Source: Bordoni et al. (2025)#
Mid-term project#
Please chose one classic paper to summarize the findings and conclusion.
What is the model the author(s) used?
Final project (following mid-term project)#
Discuss what are reasonable and unreasonable.
Can you use what you have learned to correct/improve the model?