8. Causes of Polar Amplification#
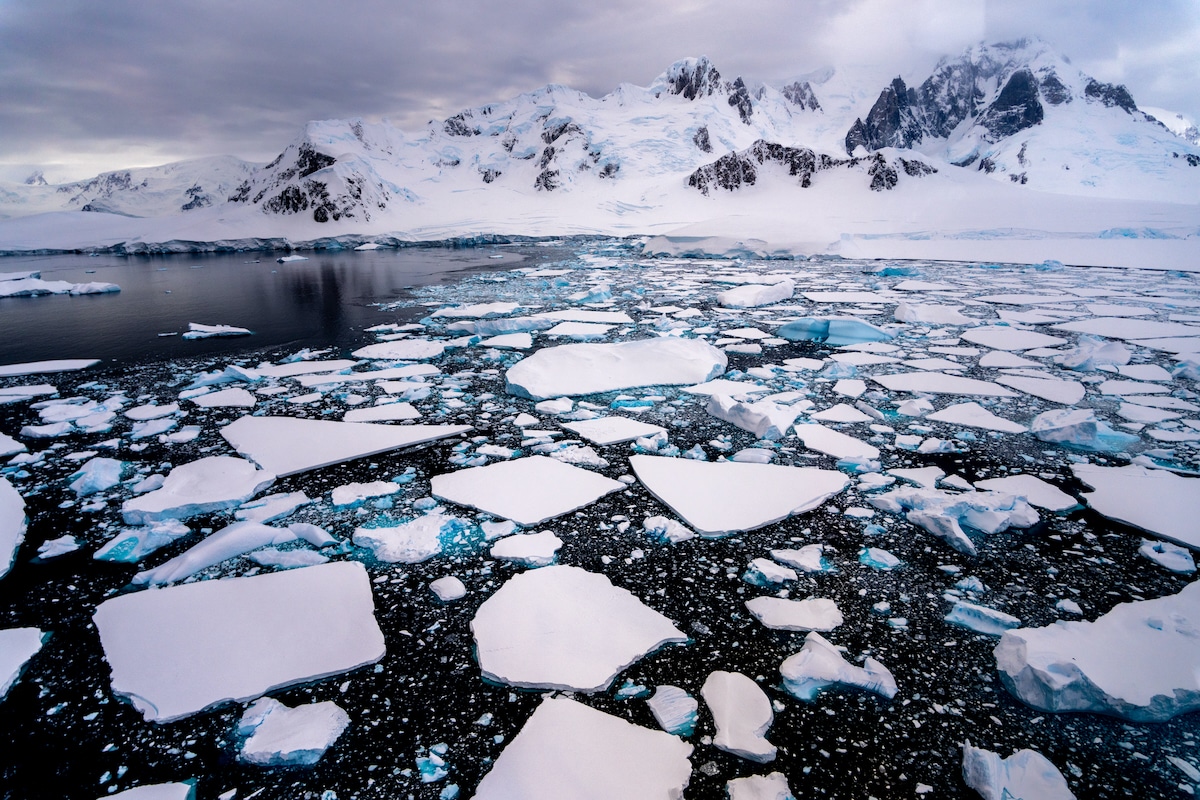
Arctic/Polar Amplification is a prominent feature of global warming!
What is Arctic amplification (AA)?#
Near-surface of the Northern Hemisphere high latitudes are warming at rates double that of lower latitudes (Cohen et al., 2014).
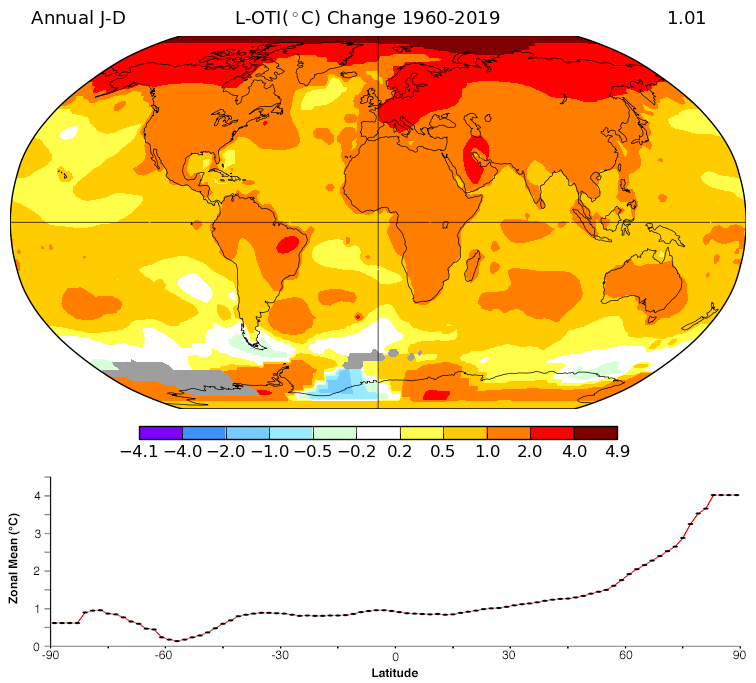
Fig. 31 Trends in mean surface air temperature over the period 1960 to 2019. The fact that Arctic warms more than the rest of the globe in the past decades signatures the Arctic amplification. Credit: NASA GISS.#
Note
“Starting with radiative-convective equilibrium, Manabe and Wetherald predicted tropospheric warming and stratospheric cooling. Upon adding atmospheric dynamics and the sea-ice albedo feedback they predicted the latitudinal pattern of global warming: polar-amplified warming and tropical upper-tropospheric warming. Finally, upon adding land processes and ocean dynamics they predicted the longitudinal pattern of global warming: land warms more than the ocean, the Southern Ocean can cool transiently.” - from Bordoni et al. (2025)
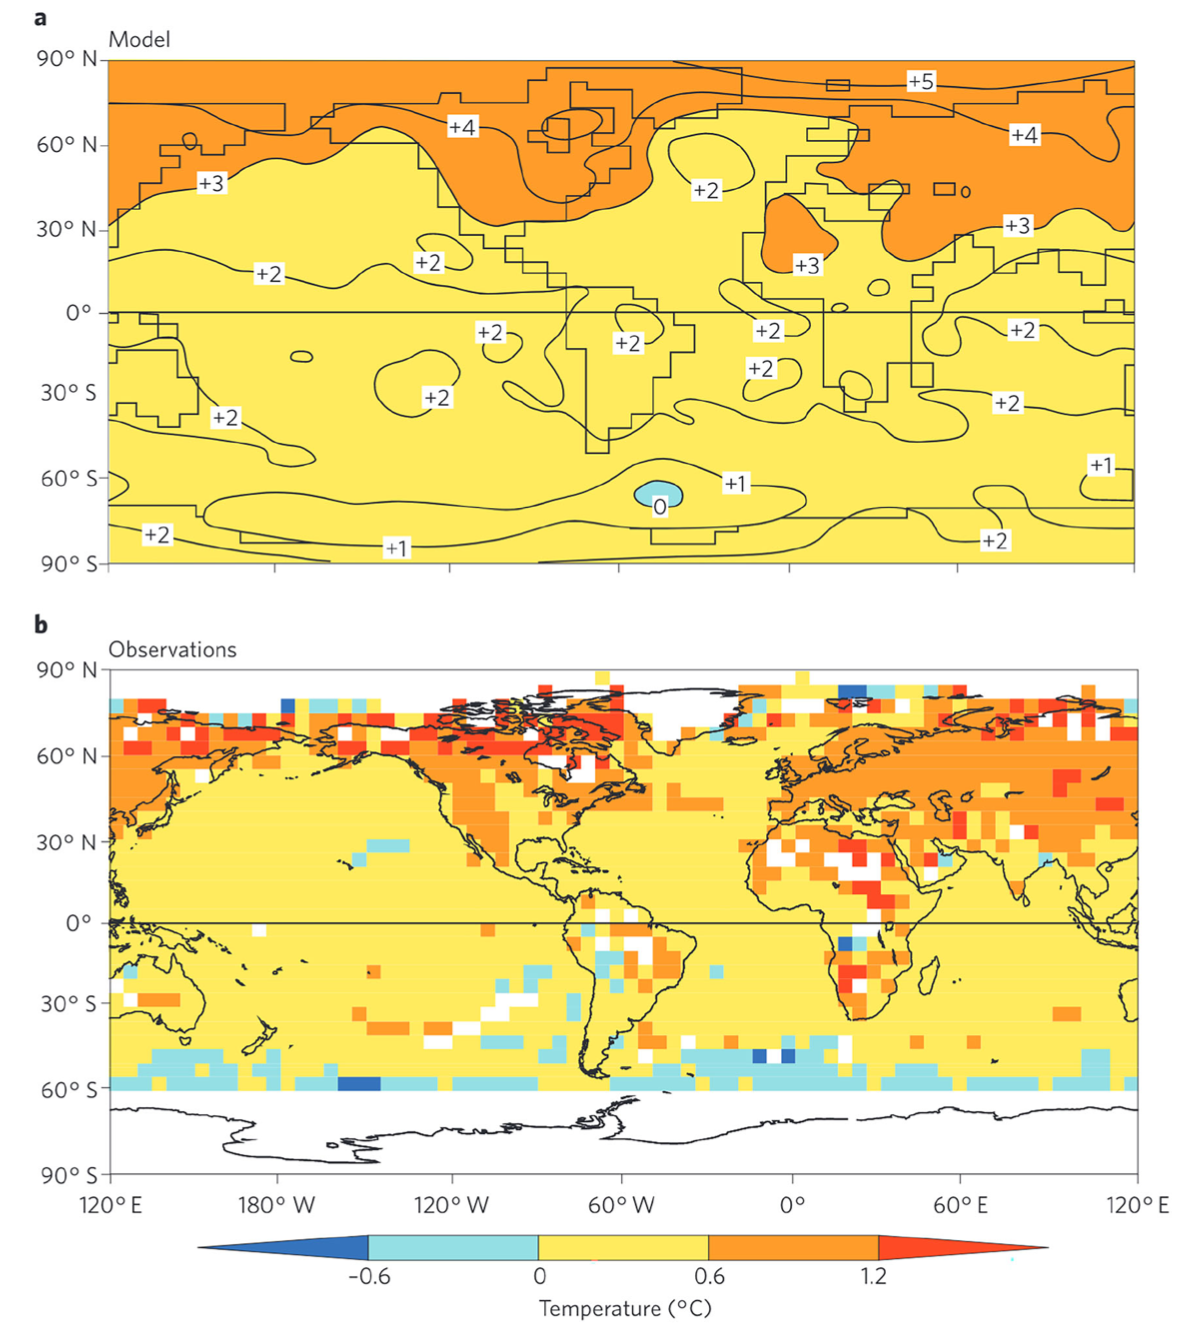
Fig. 32 Figure 1 of Stouffer and Manabe (2017). Spatial distribution of surface air temperature change in a response to (a) doubling of CO2 during year 60–80 and (b) observations between 1961–1990 and 1991–2015.#
Why AA is important?#
Local impacts on human dimension
Local impacts on nature system
Remote impacts
Quantitative definition of AA#
Arctic amplification factor (AAF): Arctic surface air temperature change divided by global surface air temperature change.
Arctic amplification efficacy (AAE): AAF\(_{XX}\) divided by AAF\(_{CO_2}\), where \(XX\) is the forcing agent.
AA in observational records and models#
Paleoclimate records
Present-day observations
General circulation model
State-of-the-art climate model and future projection
AA structure#
AA has distinct seasonal and meridional structures.
Physical mechanisms causing AA#
Climate forcing#
Greenhouse gases. For example: carbon doxide, ozone-depleting substances, methane.
Aerosols
Solar irradiance
Climate forcing details can impact the magnitude of AA (Stuecker et al. 2019)
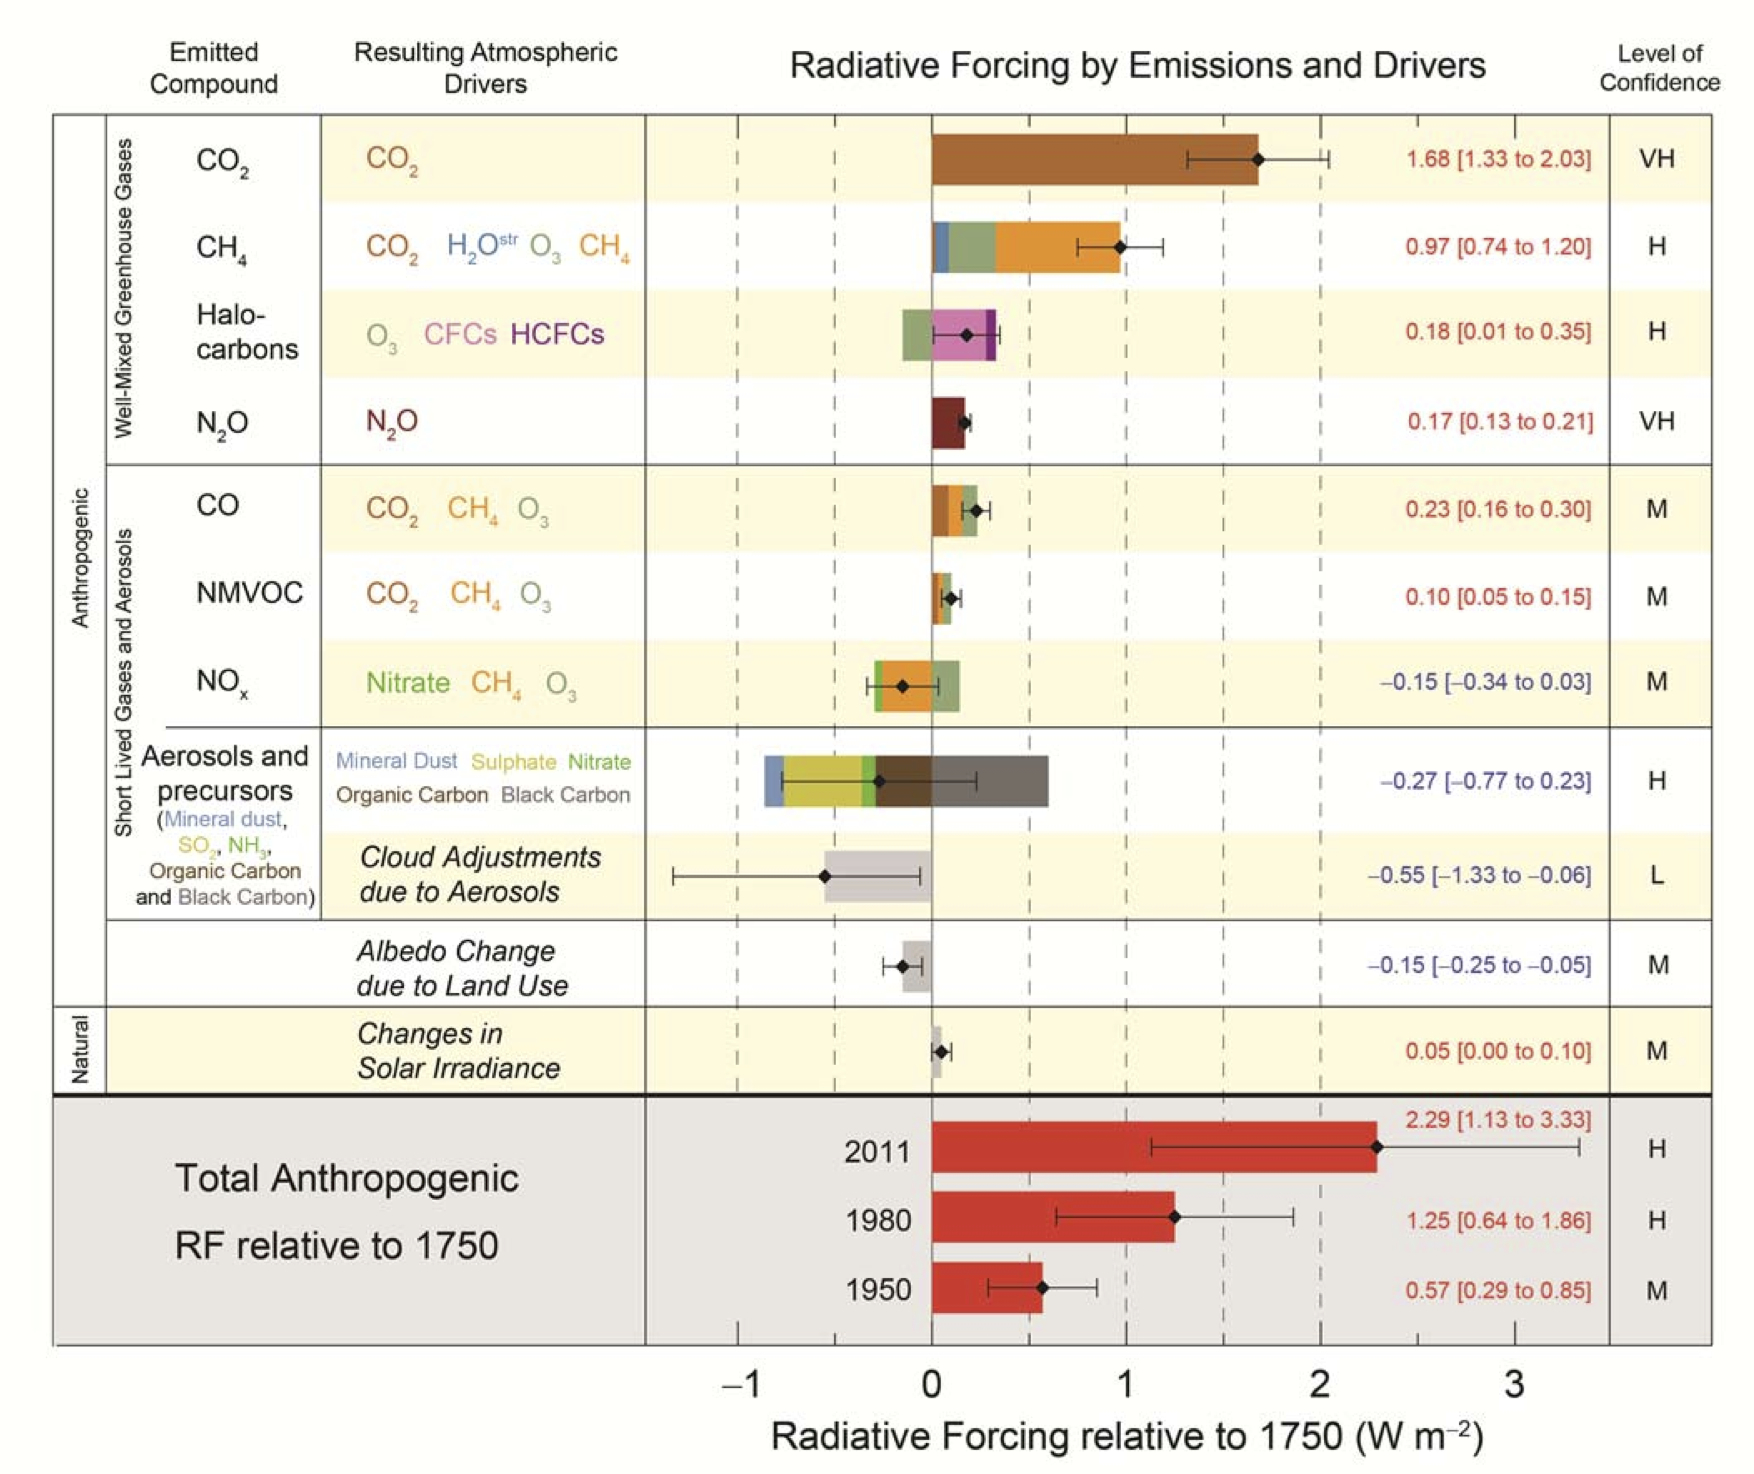
Fig. 33 Radiative forcings by emissions and climatic drivers from IPCC AR5 report. The story of evolution of radiative forcing bar charts can be seen here.#
Climate feedbacks#
A thorough review of these feedbacks’ contributions to Arctic warming can be seen in Goosse et al. 2018. We will go through each feedback in class.
Temperature feedbacks:
Planck feedback
Lapse-rate feedback
Surface albedo feedback
Water vapor feedback
Cloud feedback
Other feedbacks:
Northward shift of boreal forest and overall greening of the Arctic
Large evaporation increases in low latitudes
Oceanic heat fluxes in Arctic Ocean
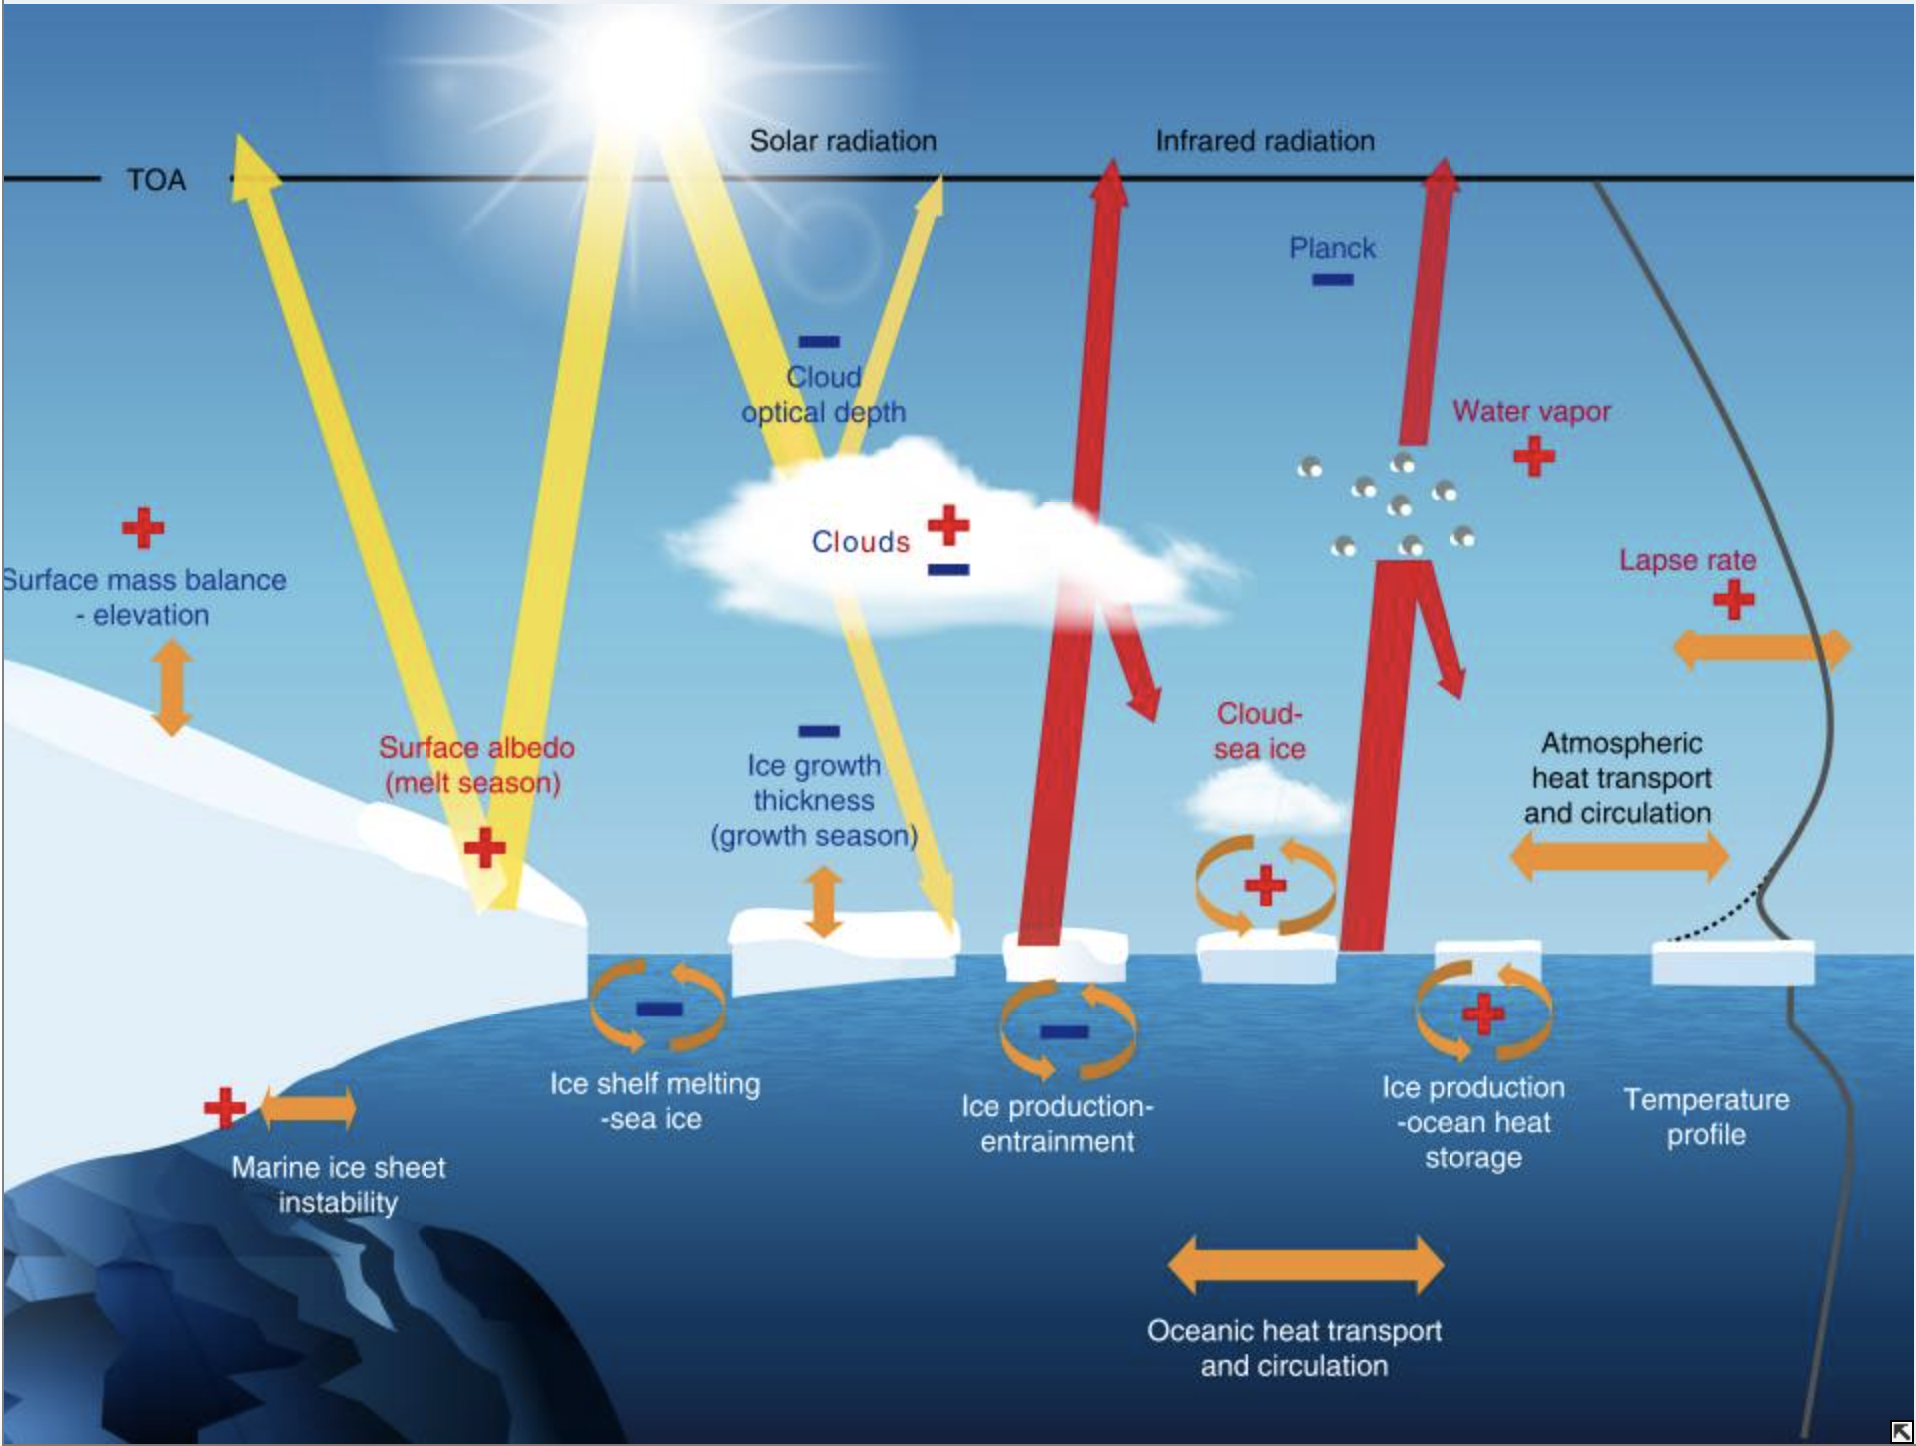
Fig. 34 A schematic of some important radiative and non-radiative feedbacks in polar regions involving the atmosphere, the ocean, sea ice and ice sheets. Source: Goosse et al. 2018.#
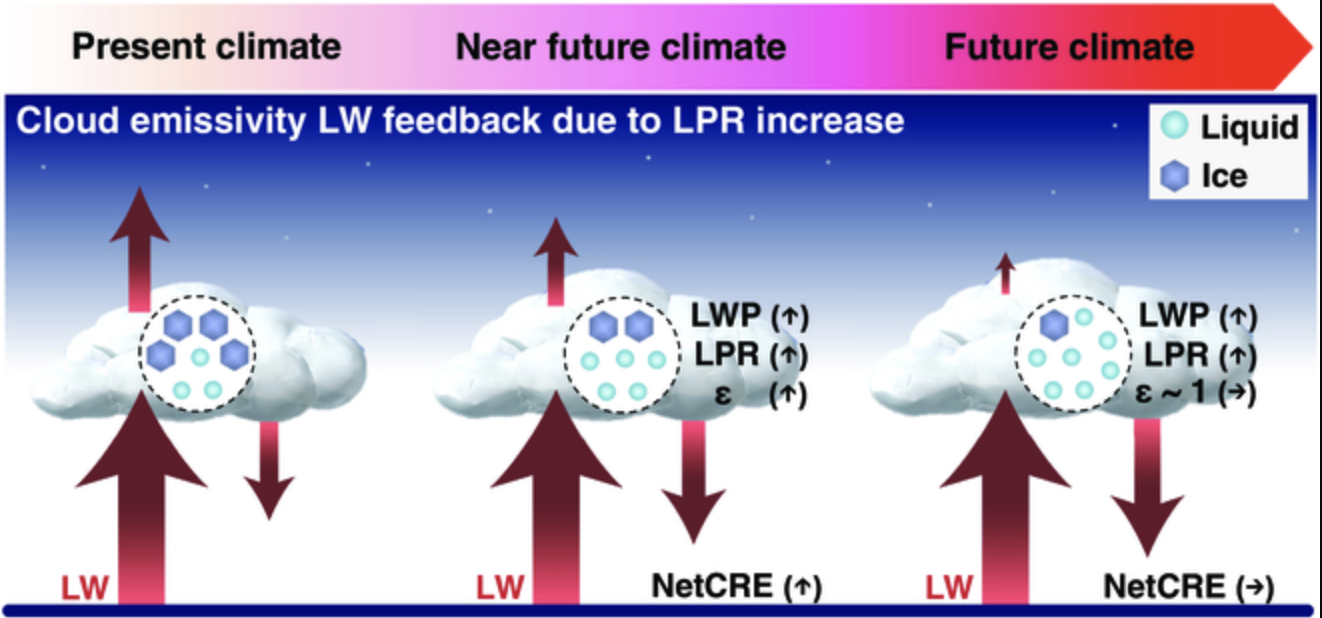
Fig. 35 Schematic diagram illustrating the time-dependent behavior of LW cloud emissivity feedback and associated variations in cloud properties. An up arrow and a down arrow from the cloud illustrate the transmissive LW radiation without being absorbed and the absorbed and re-emitted LW radiation by the cloud, respectively, out of the incident LW radiation upon the cloud from the surface (an up arrow from the surface). NetCRE increases because of the increased LPR, LWP, and thus LW cloud emissivity in response to Arctic warming. This contributes to positive feedback. The cloud emissivity-induced increment of NetCRE becomes almost zero in the future climate when attains the asymptotic value of one (i.e., a blackbody), although LPR and LWP continue to increase. Source: Nakanishi and Michibata (2025)#
Poleward energy transport#
Atmospheric transport:
Dry static energy
Moiste static energy
Oceanic transport
Circulation anomalies
Heat anomalies
Remote forcing from tropics?
Timescale affects the portion of atmospheric and oceanic heat transports
Coupling between mechanisms#
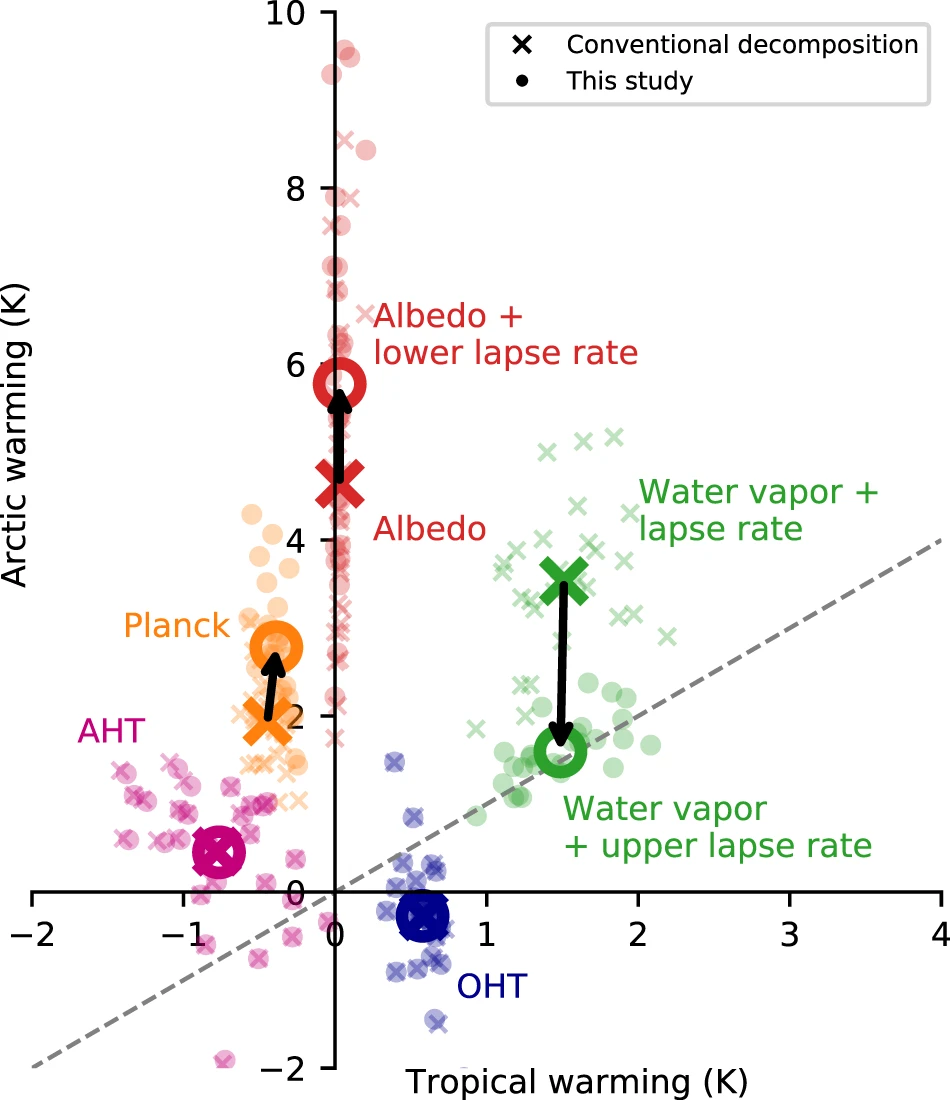
Fig. 36 Partial surface temperature change for the Arctic (60–90°N) compared to the tropics (30°S–30°N). Crosses are for conventionally defined temperature feedbacks and circles are for temperature feedbacks herein defined. Source: Feldl et al. (2020)#
Climate state dependence#
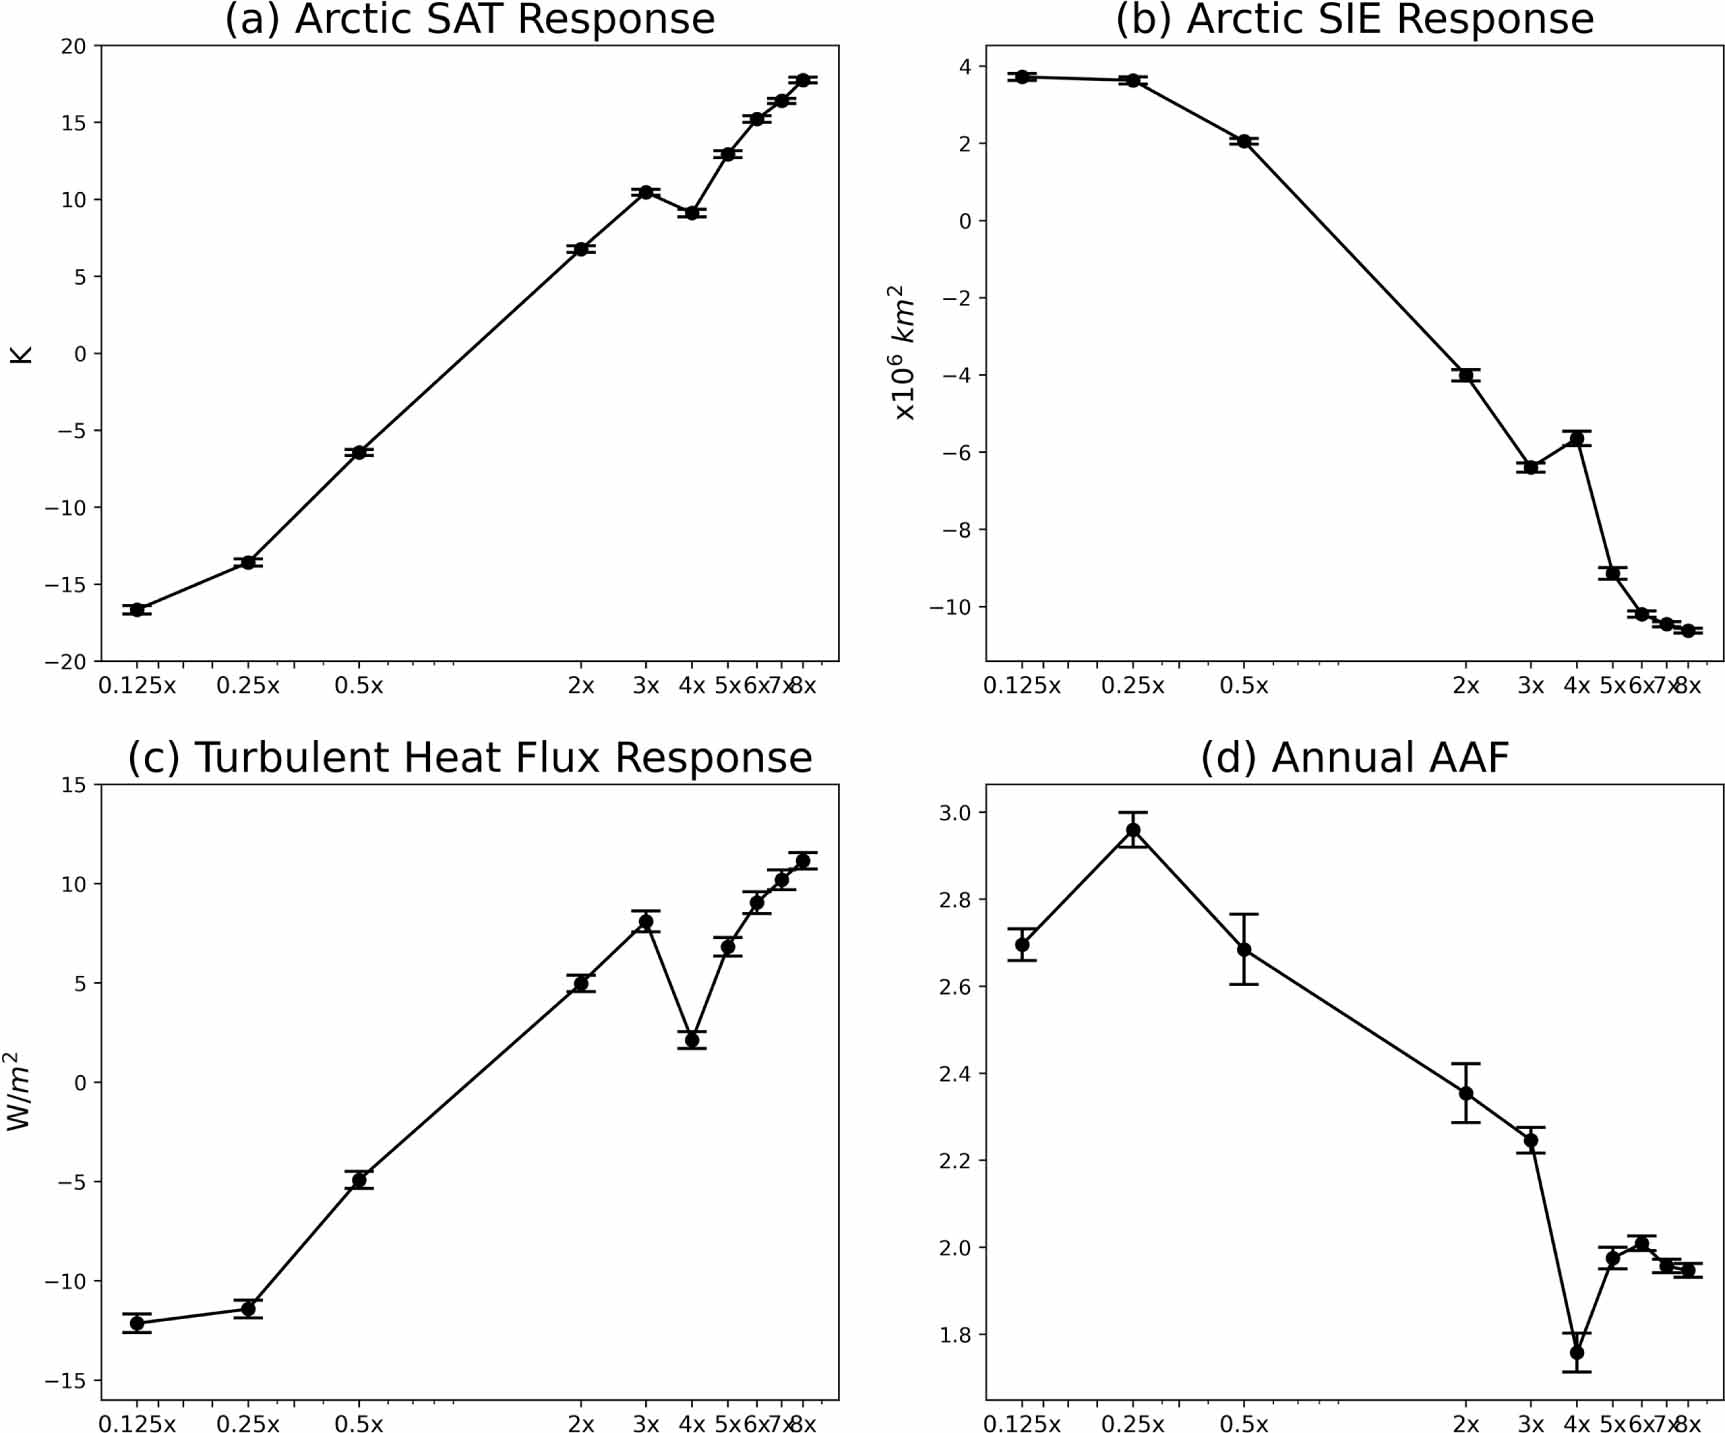
Fig. 37 The response of the annual-mean (a) Arctic SAT, (b) Arctic SIE, (c) turbulent (latent plus sensible) heat fluxes, and (d) AAF, averaged over the last 30 years of the n×CO2 simulations. Error bars in each panel denote 95% confidence intervals calculated using Student’s t-distribution. Spurce: Zhou et al. (2024)#