
20. Observations#
The Svalbard archipelago region#
113年度國科會公告大地科北極研究聯合助攻計畫申請,強化台灣的北極研究。我有機會可以接觸這個計畫,並且和多位參與計劃的學者和研究員互動。 Since then, I started to follow research works on Svalbard climate change and modeling literature.
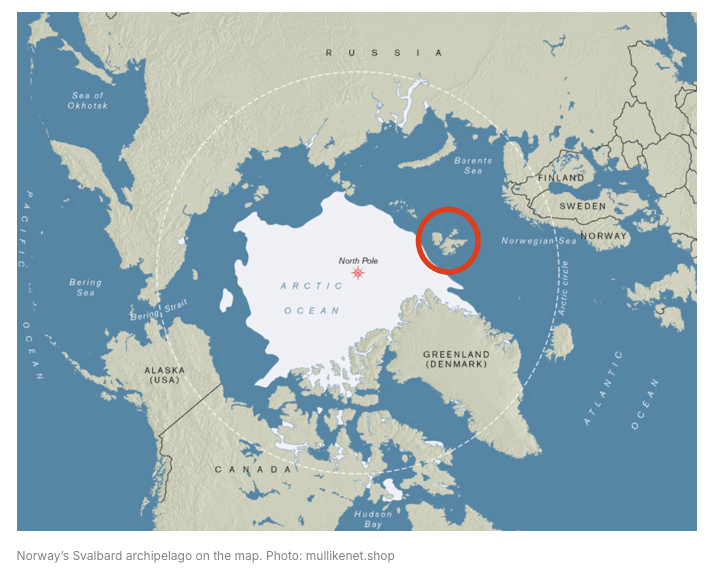
Fig. 60 Source: EUROMAIDAN#
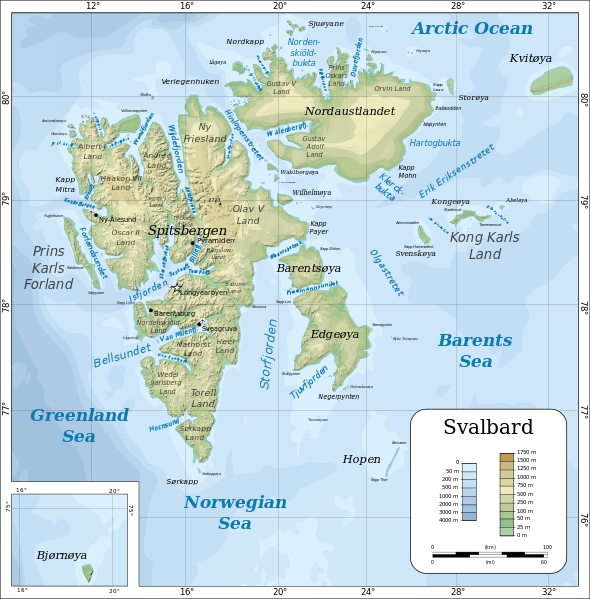
Fig. 61 Courtesy: wikipedia#
Location of Taiwanese station#

2024 record-breaking summer in Svalbard#
A recent paper, van den Broek et al. (2025), documented the record-breaking summer in Svalbard in 2024. Let’s go through the paper!
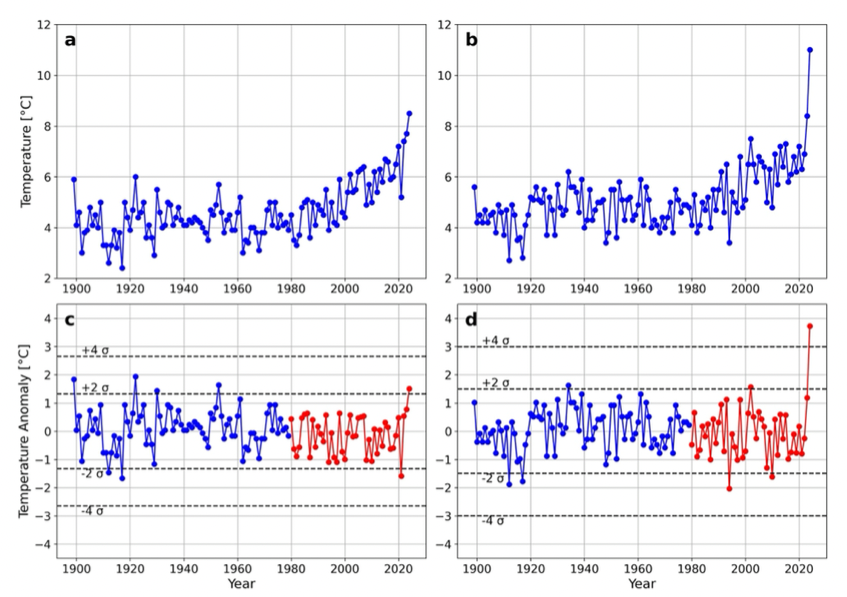
Fig. 62 Time series of (a) seasonal mean temperature for summer (June–August) and (b) monthly mean temperature for August at Svalbard Airport. Plots (c)–(d) show temperature anomalies relative to the climatology of 1900–2023, where years 1980–2023 are detrended. The red color represents the detrended temperature anomalies. Black dashed lines indicate the scale of standard deviation relative to the 1900–2023 climate, with 1980–2023 detrended.#
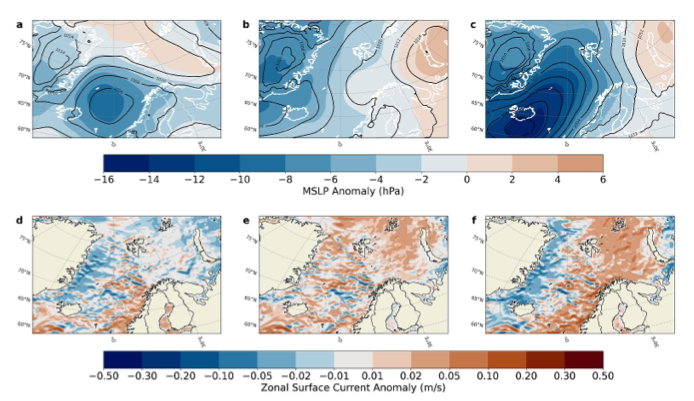
Fig. 63 (a)–(c) ERA5 reanalysis mean sea level pressure (MSLP) anomaly (shading) and average MSLP given by the isobars (black contours) for June (a), July (b), and August (c). (d)–(f) Shading as (a)–(c), but for ORAS5 reanalysis zonal surface current anomaly (m/s).#
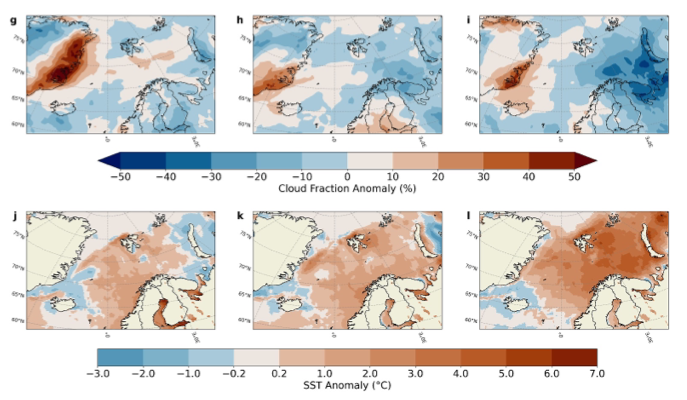
Fig. 64 (g)–(i) As (a)–(c), but for anomalies of the ERA5 reanalysis average cloud fraction (%). (j)–(l) As (a)–(c), but for ERA5 reanalysis SST anomalies.#
They perform the tracking analysis:
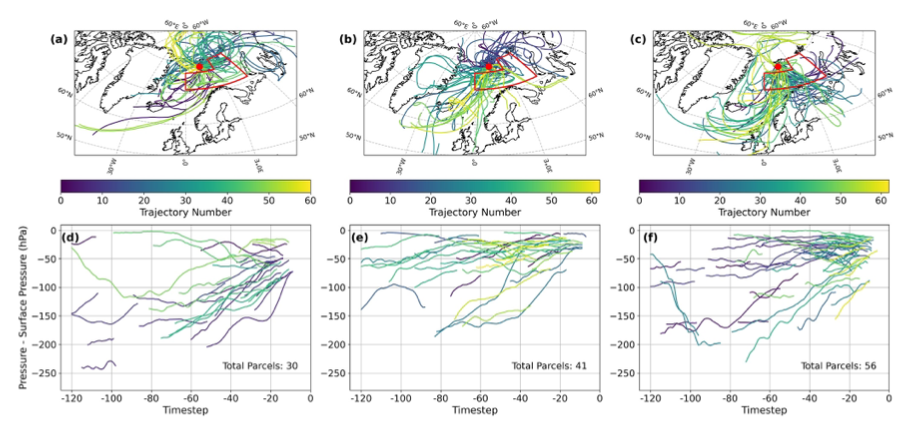
Fig. 65 (a)–(c) operational European Centre for Medium-Range Weather Forecasts analysis backward LAGRANTO trajectories (−120hr) initialized at the Svalbard Airport (red dot) for June, July, and August, respectively. Trajectory number 0 indicates parcels initialized at 00 UTC on the first day of the month, with every following trajectory being initialized 12hr later. Details: Note 1 in Supporting Information S1. Panels (d)–(f) show the parts of the trajectories that reside in the red box in Figure (a)–(c) for at least 12hr. Y-axis indicates the pressure minus the surface pressure, representing the height of the air parcel. Especially in August, many parcels show prolonged amounts of time at low elevations above the sea surface towards the end of the trajectory. Annotated is the total number of parcels that resides in the defined area for at least 12hr.#
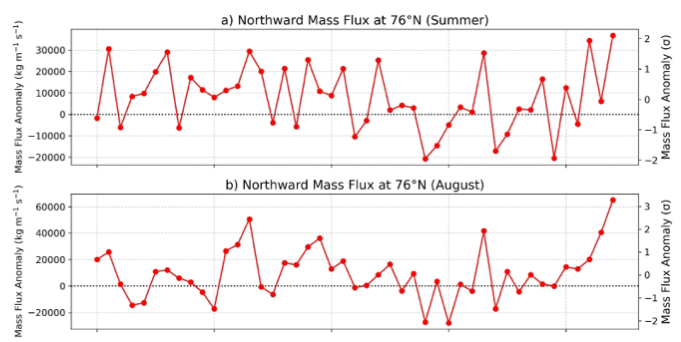
Fig. 66 (a), (b) Northward atmospheric mass flux anomaly relative to 1980–2023 average (kg m−1s−1, left y-axis; standard deviations, right y-axis) at 76°N in the sector 10–30°E in summer and August respectively.#
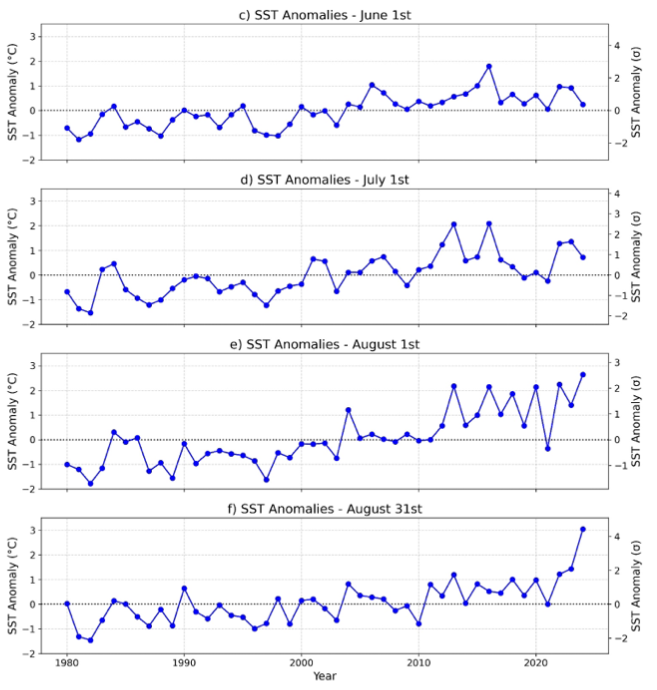
Fig. 67 (c)–(f) SST anomalies (°C, left y-axis; standard deviations, right y-axis) south and east of Svalbard (red box in Figure 3), for four selected dates: June 1st, July 1st, August 1st, and August 31st, relative to their 1980–2023 baseline.#
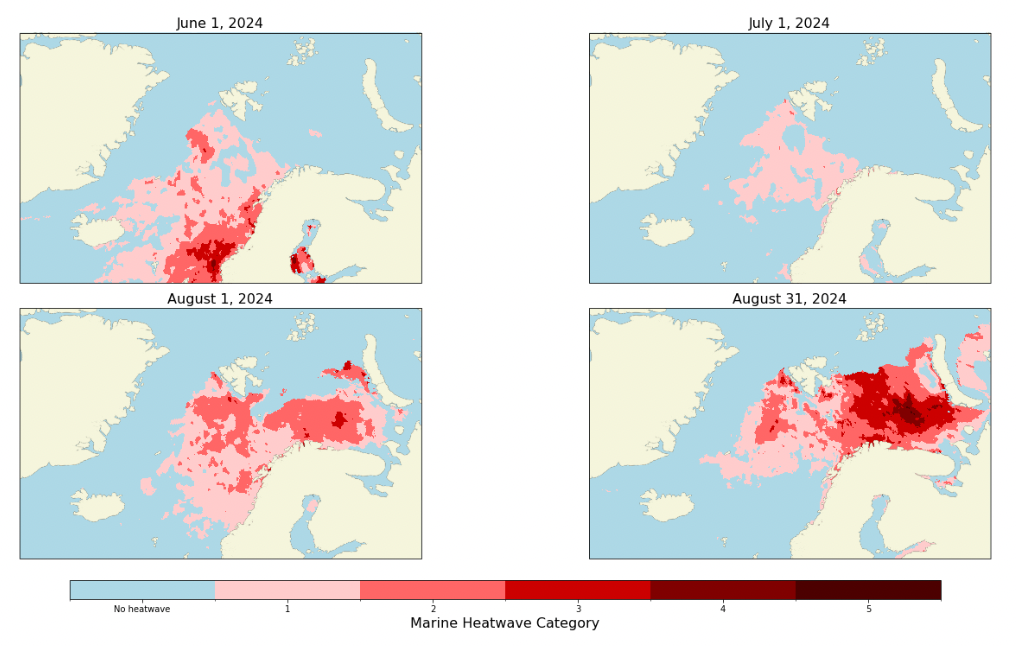
Fig. 68 Over the course of summer, a strong marine heatwave developed over the Barents Sea and northeastern Norwegian Sea, according to the NOAA Marine Heatwave Watch regionally peaking up to a category 4 (classification: extreme) heatwave.#