19. Arctic-Midlatitude Linkage#
Arctic-Midlatitude Linkage has been hotly discussed and debated in the past years. Here’s an an article on “CarbonBrief”.
Brief history of Arctic mid-latitude linkage study#
1914: Swedish meteorologist Hugo Hildebrand Hildebrandsson
1924: Russian oceanographer Wlaimir Juljewitsch Wiese
1973: R. L. Newson published a Nature paper, which used GCM to study Arctic sea-ice impacts on the atmosphere.
2010: J. A. Screen published a Nature paper, which showed that Arctic sea ice plays a central role in Arctic Amplification.
2012: J. A. Francis and S. T. Vavrus published a GRL paper, which linked Arctic warming to extreme events in midlatitudes.
2013: Elizabeth A. Barnes’s GRL paper (argued the Arctic-midlatitude linkage).
2014: J. M. Wallace’s Science paper.
2014: J. Cohen’s review paper on Nature Geoscience (stratosphere).
2020: J. Cohen’s review paper on Nature Climate Change (divergent consensus)
Arctic sea ice loss and increasing extreme events in the Northern Hemisphere#
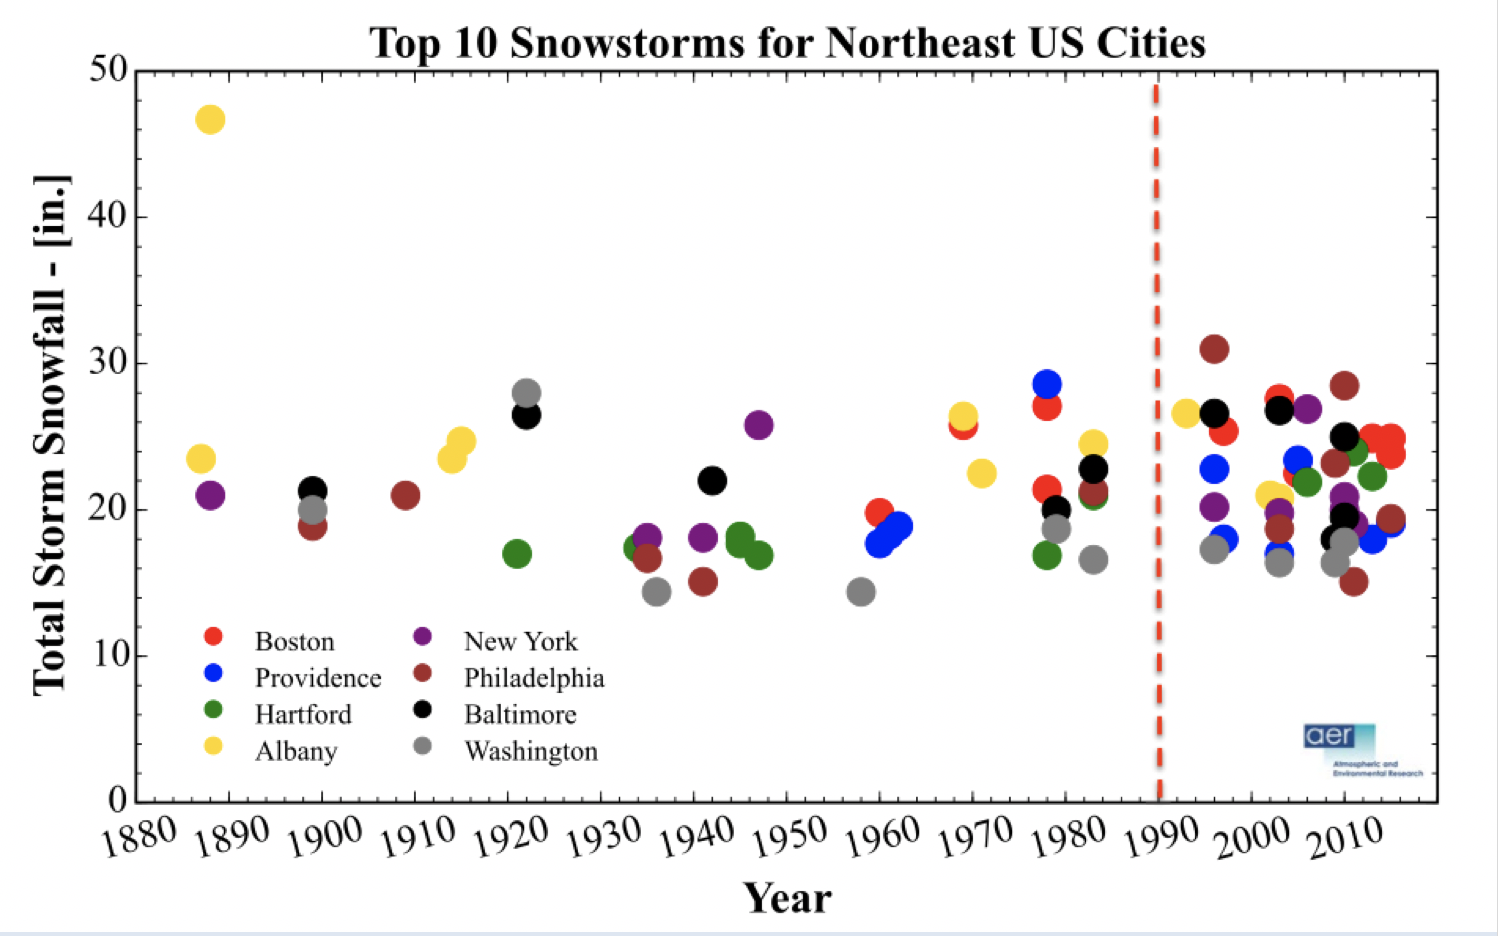
Fig. 56 Snowstorms in U.S. cities. Source: AER.#
Warm Arctic-cold Eurasia (WACE) pattern#
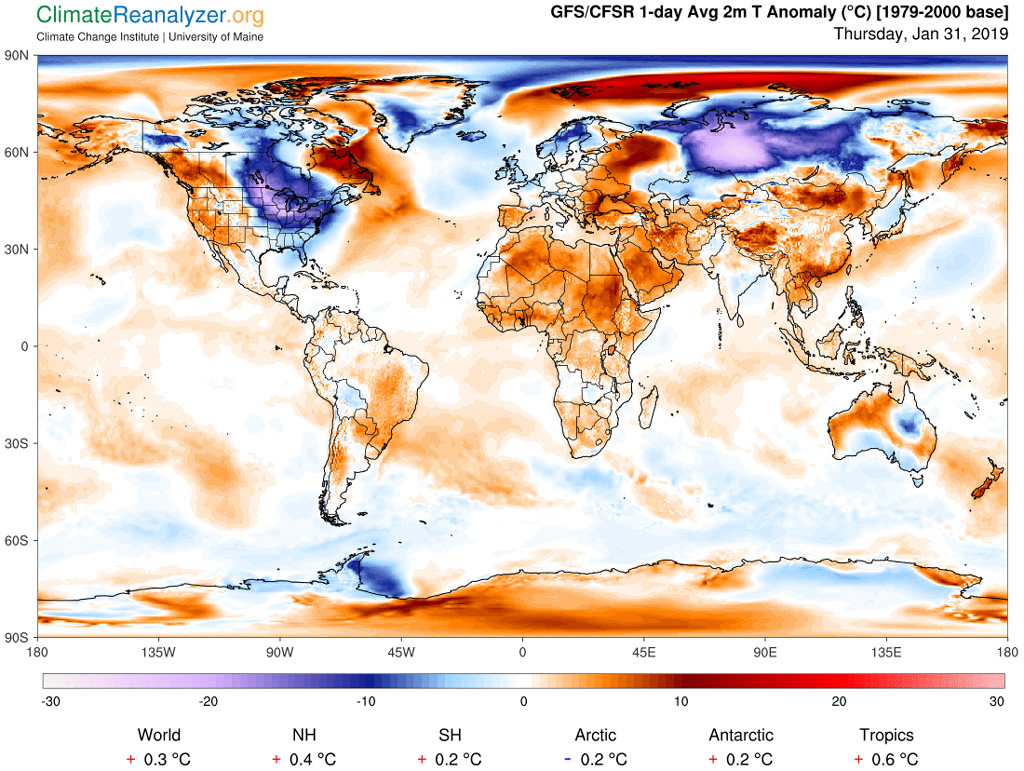
Fig. 57 Map of global temperatures for 31 January 2019, shown as anomalies from a 1979-2000 baseline. Source: Climate Change Institute, University of Maine.#
Arctic warming and mid-latitude Rossby waves#
Francis and Vavrus (2012) GRL paper was among the first to propose that Arctic warming could affect mid-latitude extreme via altering large-scale atmospheric waves. However, the comtemporary studies showed weak, or opposite results.
Proposed mechanisms#
Waiver jet stream
north-south temperature gradient + Rossby wave (Francis & Vavrus 2012).
storm tracks + NAO/AO (Cohen & Barow 2005; Deser et al. 2007; Honda et al. 2009).
warm Arctic-cold continents (WACC) pattern (Cohen et al. 2014).
Polar vorrtex
SSW breakdown (Kim et al. 2014; Kretchmer et al. 2018).
Wave resonance
in summer season only (Petoukhov et al. 2013)
the theory of quasi-resonant amplification (QRA, Coumou et al. 2014; Mann et al. 2017)
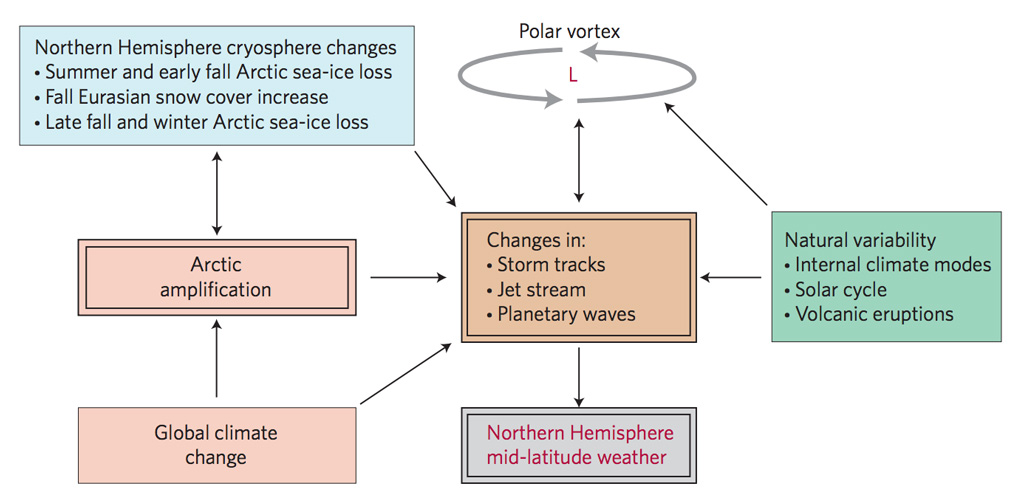
Fig. 58 Schematic of influences on northern hemisphere mid-latitude weather. Source: Cohen et al. (2014)#
Observational and GCM inconsistency#
Jet stream
NAO
Arctic Amplification and Severe Weather Events
Sources of Disagreement in Model Experiments
Large internal atmospheric variability -> low signal-to-noise ratio
Causality
Debates on the Arctic-midlatitude linkage#
Debates on Mori et al. (2019)
First debate: Screen and Blackport (2019) and Mori et al. (2019)
Second debate: Zappa et al. (2021) and Mori et al. (2021)
PAMIP – Polar Amplification Model Intercomparison Project#
The PAMIP paper: Smith et al. (2019)
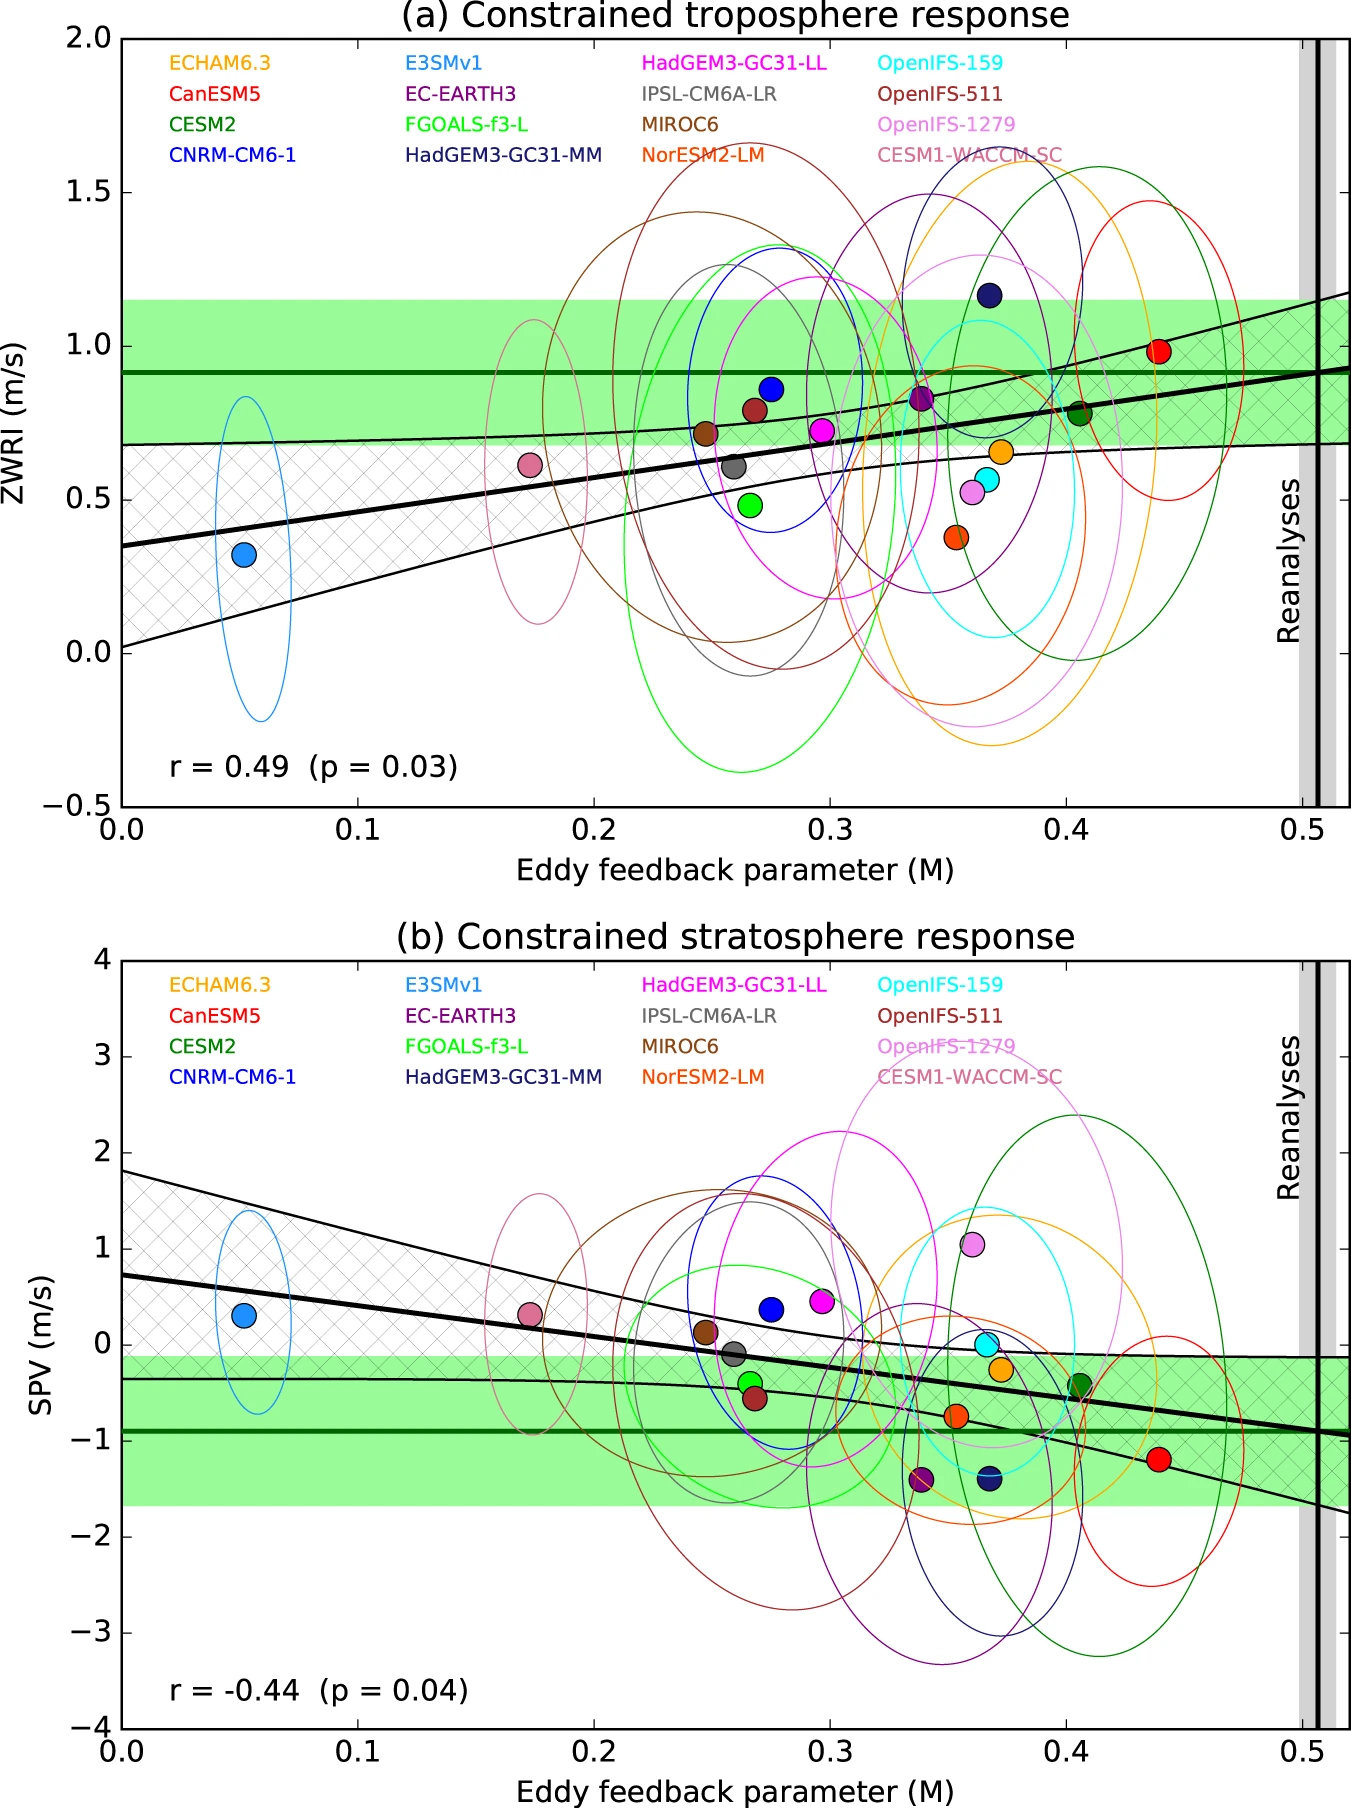
Fig. 59 a Emergent constraint based on the ensemble regression (ER) between eddy momentum feedback and the zonal wind response index (ZWRI). Black line shows the regression with hatching showing the 95% confidence interval. Horizontal green line shows the constrained ensemble mean response, with the shading showing its 95% confidence interval (Methods). Vertical black line and grey shading shows the mean and range of eddy feedback from the reanalyses. Ellipses show the 95% uncertainties obtained by bootstrapping with replacement the ensemble members. b As a but for the stratospheric polar vortex (SPV) response. A one-sided test is used to calculate p values since we expect the response to increase as eddy feedback strengthens. All data are for DJF. Source: Smith et al. (2022).#
Sources and papers#
Review article: Cohen et al. (2014)
Key paper: Francis and Vavrus 2012
Weakened evidence: Blackport and Screen (2020)
Model consistency and discrepancy: Screen et al. (2018)
Divergent consensus Cohen et al. (2019)
Robust but weak response: Smith et al. (2022)